수문기상 관측정보를 활용한 안동댐 유역 기후권역 구분 및 분석
Abstract
Watershed area can be submerged due to constructions and management of dams, and these change can impact not only on ecosystem and environment of river basin area but also on local climate. This study is conducted to construct and classify climate zones of Andong Dam watershed where the area is submerged due to the construction of the dam. By applying Principal Components Analysis (PCA) and Getis-Ord Gi* statistics, three climate zones were classified for the result. Each zone was then analyzed and validated with climatic and geological features including topography, land cover, and forest type map. As a result of the analysis, there was a difference in temperature, elevation, precipitation and tree species distribution among the zones. Also, an analysis of land cover map showed that there were more agricultural land near Andong Reservoir. This study on the climatic classification is considered to be useful as the basis for decision-making or policy enforcement regarding ecosystem, environmental management or climate change response.
Keywords:
Climate Zone, Hydro-Meteorology, Principal Components Analysis (PCA), Getis-Ord Gi*, Cluster Analysis, Andong Dam Watershed1. 서 론
우리나라는 계절별로 극심한 수자원 불균형을 가지고 있어 홍수와 가뭄 등 기후변화로 인한 재난재해 취약성이 높은 편이다. 최근 우리나라에는 홍수 및 가뭄 등 물과 관련한 재해가 증가하고 있으며, 이에 따른 영향이 확대될 것으로 예측되고 있다(Dibike and Coulibaly, 2005; Park et al., 2012). 이러한 재해로부터의 영향을 최소화하고, 수자원을 관리하기 위한 일환으로 댐을 건설하기도 하며(Baxter, 1977), 낙동강 상류에도 안동댐이 건설되었다. 그러나 댐 건설로 인한 수면적 변화는 주변 유수생태계를 변화시키고, 수질에 영향을 주며, 토양의 형태를 변화시킨다(Johnson et al., 1976; Baxter, 1977, 재인용; Cadwallader, 1986; Bren et al., 1988; Bren, 1992; Toner and Keddy, 1997). 또한, 댐의 운영은 하류의 수문을 변화시키며, 보통 생태계 악화 및 생물다양성 손실, 그리고 서식지 파괴로 이어진다(Jolly, 1996; Richter et al., 1997; Scott et al., 1997; Kingsford, 2000; Maingi and Marsh, 2002). 이러한 댐 건설 및 운영은 수문지역의 기후에도 영향을 줄 수 있다(Matthews et al., 2005; Kemenes et al., 2007).
수문기상변화를 파악하고, 이에 대응하기 위하여 기후권역을 구축하고, 권역화 결과를 바탕으로 하는 연구, 정책 수립, 또는 체계적인 관리가 필요하다. 일부 선진국은 국가 환경계획을 수립할 때 구축한 기후권역 지도를 기후변화에 따른 생물종 서식처 보전전략 및 취약성 평가 등에 활용한다. 영국은 89개의 기후변수를 활용하여 영국과 아일랜드 전역을 21개 생물기후권역(bioclimatic classification)으로 구분하고, 통합적 기후영향평가를 하는 MONARCH(Modelling Natural Resource Responses to Climate) 사업을 실시하고 있다(Hossel et al., 2003; Harrison et al., 2001). 미국에서는 전국 규모(national scale)부터 지역 규모(local scale)까지 기상인자를 활용하여 생태학적으로 분류하는 연구들이 다양하게 진행되어 왔으며(Jordan, 1982; Bailey, 1983, 1987; Omernick, 1987; United States. Forest Service. Huron-Manistee National Forest, 1993; Host et al., 1996), 이러한 연구는 생태계 구조 및 기능을 관리하고, 자원 관리방안을 개발하며(Cleland et al., 1992), 야생동물의 서식지를 평가하고(Johnson et al., 1991), 환경을 보존하는데 활용되었다.
Kim et al.(2007)은 67개의 변수를 이용하여 한반도를 18 km2의 격자 크기로 하는 21개의 생물기후권역으로 나누었다. 생물기후권역화를 통해 권역별 기후변화 취약성을 평가하고, 생물다양성 및 자연생태계 보전 및 복원 대응 전략을 수립하고자 하였으나, 이를 국가환경종합계획 등에 적절히 활용하지 못하고 있는 실정이다.
우리나라에서 수행된 기존의 연구는 지역적 규모의 기후권역 지도가 구축되어 있지 않으며, 지형요소를 반영하고 있지 않는 한계가 있다(Jeong et al., 2012). 특히 수문지역은 주변 수역의 영향을 많이 받고, 기후변화의 영향에 따라 식생의 분포가 달라져 증발산과 토양수분 등 수문인자에 변화를 야기하므로(Choi et al., 2013), 이러한 변화를 확인할 수 있는 지역적 규모 또는 유역단위의 기후권역의 구축이 요구되어진다. 수문지역의 기후권역화를 위해서는 지역에서 얻을 수 있는 기상관측자료를 활용하고(Kahliq et al., 2006), 기상뿐 아니라 지형, 식생, 수계 등의 다양한 자연변수들을 모두 반영해야할 것으로 사료된다.
본 연구에서는 댐 건설로 인해 인위적으로 수몰된 안동댐유역을 대상으로 유역단위의 기후권역을 구축하고자 한다. 이를 위해서 국립기상과학원에서 설치ㆍ운영하고 있는 낙동강 상류 안동댐 유역의 수문기상 관측소의 기상정보와 지형 및 수계 자료를 활용하고, 기후권역을 구축하여 각 권역의 특성을 분석하였다.
2.1 연구대상지
2. 재료 및 방법
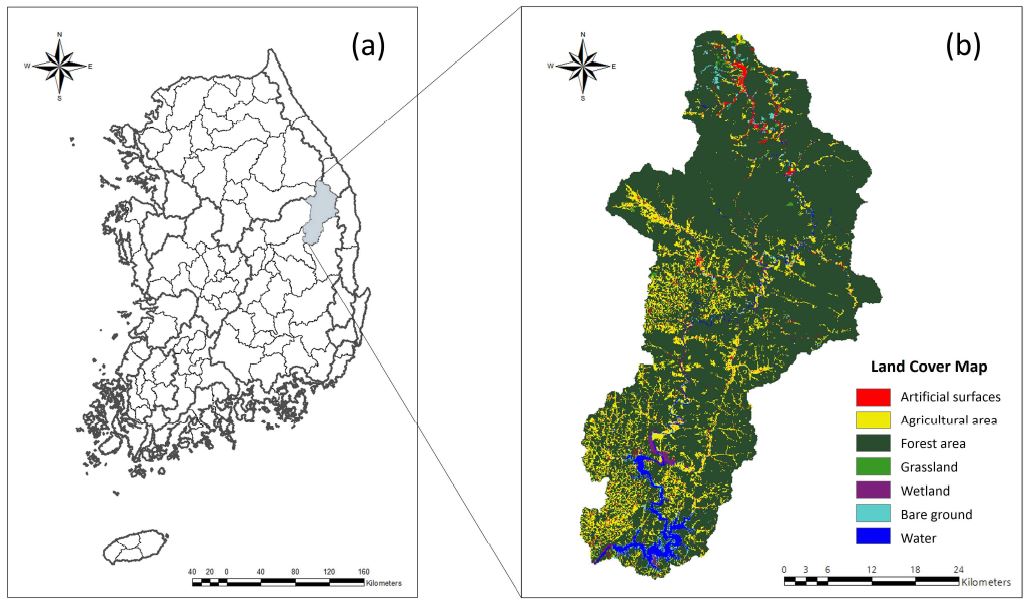
본 연구의 대상지는 낙동강 상류 안동댐 유역으로, 약 1,628 km2에 해당하는 면적이며, 안동댐은 낙동강 발원지에서 가장 가까운 곳에 위치한다(Fig. 1). 이 유역은 8곳의 대형 보가 설치되어 안동호 주변이 인위적으로 수몰되어 수면적이 크게 변하였다. 안동댐 상류지역은 전 유역의 87.7%가 산림으로 이루어져 있지만(Ji et al., 2012), 개간한 농지가 낙동강을 따라 존재한다. 수면적과 수문환경의 변화는 주변 지역의 식생과 토양수분, 미세기후 등을 변화시키며, 이는 생태계에 교란을 일으키고, 농업 종사자가 많은 지역사회에 영향을 미칠 가능성이 있다.
2.2 활용 변수 및 자료구축
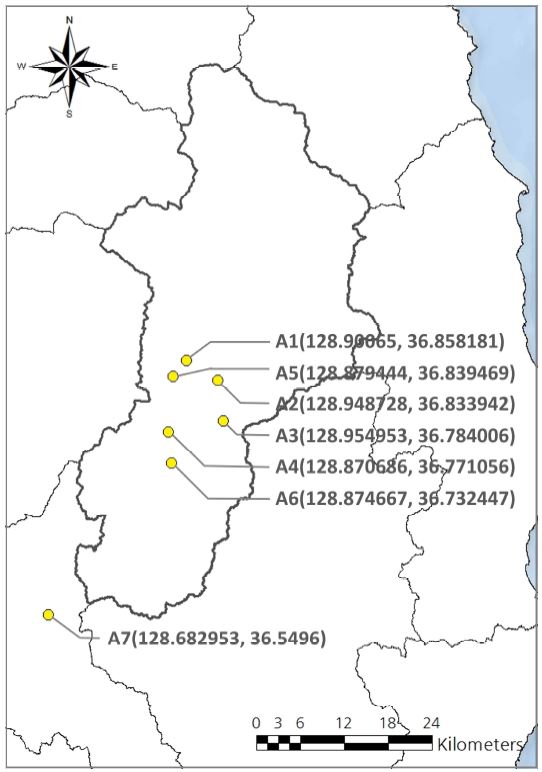
국립기상과학원은 안동댐 유역에 7개소의 수문기상관측소를 설치ㆍ운영하고 있다. 2011년에 안동댐 상류지역인 도천리, 상리, 남면리, 가송리에 4개 지점이 설치되었고, 2012년에는 보다 정밀한 수문기상 및 플럭스자료를 얻을 수 있도록 풍호리에 수문기상 관측장비, 원천리와 옥동에 플럭스 타워가 각각 설치되었다(Fig. 2). 관측소는 분 단위로 기온, 강수, 습도, 일사량, 풍속, 토양수분, 지중온도 등을 관측하며, 두 곳의 플럭스 타워에서는 잠열, 현열, 지열, 순복사량, CO2, H2O 등을 추가로 관측하고 있다(NIMR, 2013).
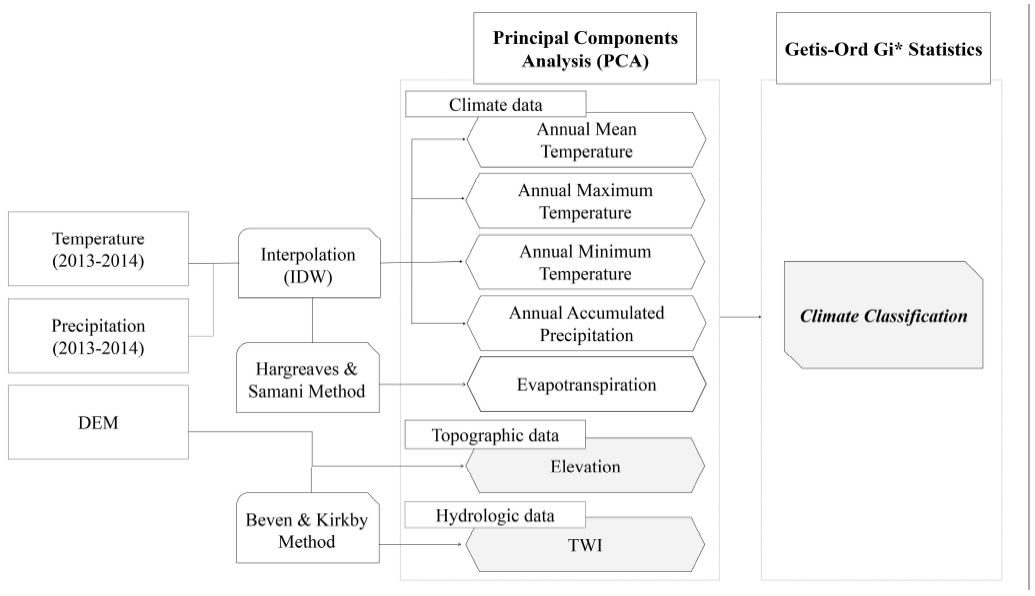
본 연구에서는 미세 기후권역 구축을 위하여 기후, 지형, 수계로 분류되는 7개의 자료가 활용되었다. 기후자료는 관측소에서 측정된 2013년도와 2014년도의 연평균기온, 연평균최고기온, 연평균최고기온, 연평균누적강수량, 증발산량 자료를 가공하여 100 m 공간분포의 규모로 역거리가중(Inverse Distance Weighting, IDW) 보간법을 이용하여 내삽(interpolation)하였다. 내삽 과정에서 기후자료에 고도를 고려하였는데, 이는 우리나라가 복잡한 지형과 피복으로 인해 국지적인 기후특성을 가지며, 국지기온 결정인자로서 고도의 영향이 현저하기 때문이다(Hong et al., 2007; Lee et al., 2011). 기온자료에는 Yun et al.(2000, 2001)이 제안한 기온증감률(Γ) 보정식을 적용하여 지형의 특성을 반영한 자료를 구축하였다(Nalder and Wein, 1998; Lee et al., 2007). 또한, 강수량 분포는 고도와 강수량의 관계를 밝힌 Smith (2008)의 방법을 적용시켰다.
증발산량은 비교적 취득이 용이한 기상자료를 가지고 정확도가 높은 증발산량을 추정하는 Hargreaves 방법과 Thornthwaite 방법이 대표적이며(Hargreaves and Samani, 1985), Thornthwaite 방법은 필요한 변수가 월평균 공기온도 하나로, 결과를 도출하기가 간단하다는 장점이 있다. 그러나 토양수분을 고려하지 않은 잠재증발산량만을 나타내기 때문에, 건조 지대의 잠재증발산을 과대평가하는 경향이 있다(Mintz and Walker, 1993). Hargreaves 방법은 필요한 변수가 기온과 일사량이며, 양질의 토양수분 자료와 다양한 기후조건에서 검증이 이루어졌다(Hargreaves, 1994). Alkaeed et al.(2006)의 연구에 의하면 Hargreaves 방법을 이용한 결과가 Penman-Monteith(PM) 방법의 결과와 거의 유사했으며, 신뢰할 만한 자료가 부족한 경우에는 Hargreaves의 방법이 권고되어진다고 밝혔다. 이러한 이유로 본 연구에서는 Hargreaves의 방법을 활용하였다.
비기후변수인 지형과 수계자료는 위성영상(MODIS, DAVHRR)을 기반으로 구축되었다. 지형자료는 수치표고모형(DEM)을 활용하였고, 수계는 지형습윤지수(TWI)를 이용하여 100 m×100 m 해상도의 면 형태의 자료로 구축되었다(Beven and Kirkby, 1979). 각 Raster는 162,000여개의 pixel로 구성되었다(Table 1).
2.3 분석 방법
기후권역화를 위하여 통계적인 방법에 기반한 주성분 분석(Principle Components Analysis)과 군집분석(cluster analysis)을 ArcGIS 10.3과 SPSS 23으로 실시하였다(Fig. 3). 주성분 분석은 다변량(multivariate)의 변수가 만들어내는 공분산(covariance)의 양상을 보고 변수를 줄여주는 방법으로, 초기 기후권역화 방법을 구축한 Rauscher(1984)의 연구에 활용되었다. 본 연구에서는 기후, 지형, 수계에 해당하는 7개의 변수들을 대상으로 주성분 분석을 실시하고 도출된 고유값(eigenvalue)을 바탕으로 적절한 주성분을 추출하였다.
이후 추출한 주성분으로 군집분석을 실시하였다. 군집분석은 관측대상들 간에 동질적이거나 유사한 특성을 가진 관측치끼리 군집을 형성하는 것으로, 분석의 기준에 따라 다양한 방법들이 연구되어왔다. 기존의 연구들에서는 계층적 군집분석이 널리 사용되며(Bailey, 1983, 재인용; Albert, 1995), 이 방법은 지역적인 연구에 활용될 수 있다는 장점이 있다(Host et al., 1996, 재인용). 그러나 지역유형을 구분하는데 주성분 분석 후 계층적 군집분석을 할 경우에 요인별 분산의 특성이 결과에 포함되지 않는다는 문제점이 있으며(Sang, 2002), 적절한 군집의 개수를 정하는 명확한 기준이 없으므로 연구자의 주관에 따라 군집의 개수가 달라진다는 한계점이 있다.
따라서 본 연구에서는 이러한 한계점을 보완하기 위해 공간통계 기법인 Getis-Ord Gi*(Getis and Ord, 1992; Ord and Getis, 1995; Getis and Ord, 1996) 통계를 이용하여 유역단위의 권역화를 실시하였다. 이 기법은 셀 전체를 한꺼번에 평가하여 통계적으로 양의 값을 가지면 핫스팟(hot spot)으로, 음수이면 콜드스팟(cold spot)으로 분석하기 때문에 군집의 지리적 경계를 설정하는 알고리즘에 사용되기도 하며, 고집적지를 찾는데 탁월하다고 알려져 있다(Lee et al., 2010; Kim, 2014). 본 연구에서는 이 기법을 활용하는데 있어 유클리디안 거리(Euclidean distance)를 거리척도로 이용하였다. 유클리디안 거리 척도는 변수 사이의 거리를 측정하여 변수의 분산(variance) 정도를 파악할 수 있으므로, 공간 자료 분석에 이용되는 경우가 많으며(Kelly-Hope et al., 2009; Le Gallo and Ertur, 2003), 이를 이용한 군집분석은 각 변수들이 가지는 특징의 거리를 파악하여 유사성을 가진 집단으로 분류할 때 이용되었다(Sneath and Sokal, 1973). 유클리디안 거리는 식 (1)과 같이 계산될 수 있다.
| (1) |
여기서 Di,j는 변수 I와 j의 거리를 뜻하며, Xi,k와 Xj,k는 특정 고유값 이상인 표준화된 주성분 값들을 의미한다(Schulze et al., 2003).
3. 결과 및 고찰
3.1 주성분분석(Principle Components Analysis) 및 군집분석(Cluster Analysis) 결과
주성분분석을 통해 고유값과 요인부하량을 도출하였으며, 공분산 행렬에서 구한 고유값(eigenvalue)의 크기는 변수자료의 분산 크기를 의미한다. 일반적으로 통계분석에서는 1.0 이상의 고유값을 가진 주성분만을 설명하는 K1 규칙을 많이 사용하는데(Kaiser, 1960), 이는 하나의 고유값이 변수 1개 이상을 설명해야 하기 때문이다. 이에 따라 안동 지역의 미세한 기후권역을 나누는 본 연구의 경우에도 고유값이 1.0 이상인 주성분만을 고려하였다. 1.0 이상의 고유값을 가진 주성분은 1개였으며, 제1주성분의 경우 변수들에 대해 76.263%의 설명력을 가지고 있는 것으로 나타났다(Table 2).
요인 분석을 통해 나온 요인부하량(factor loading)은 0.4 이상이 중요한 것으로 알려져 있다(Heckler, 1996). 본 연구에서 제1주성분은 요인부하량이 0.9 이상인 값을 가진 변수가 많으므로, 그 중 높은 변수를 선정하였다. 따라서 절대값을 0.9 이상을 갖는 기온, 고도 및 강수량이 제1주성분에 영향이 큰 것으로 판단되었다(Table 3).
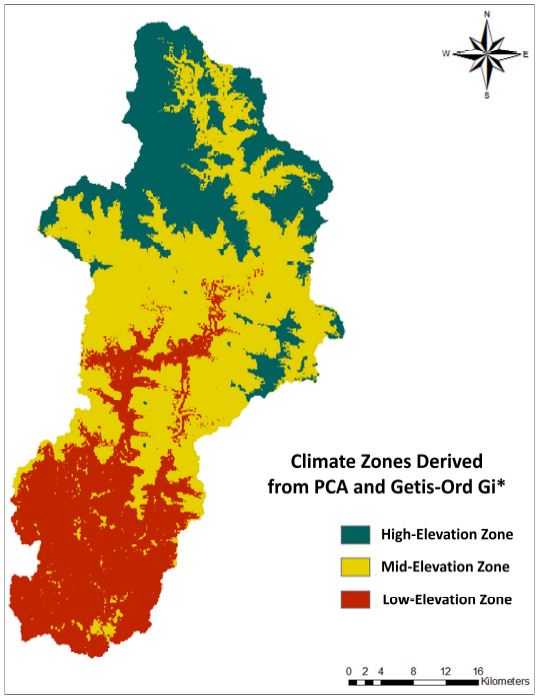
주성분분석을 통해 변수를 선정한 후, Getis-Ord Gi* 통계를 이용한 군집분석을 실시하였다. Getis-Ord Gi* 통계에서는 z값에 따라 군집을 나눌 수 있기 때문에, 본 연구에서는 90%의 신뢰구간(confidence interval)을 기준으로 군집을 구분하였다. 즉, z값이 —1.65 이하인 구간, z값이 1.65 이상인 구간, 그리고 그 사이 구간으로 나누어 하나의 주성분에서 세 개의 권역을 도출하였다(Fig. 4). 세 개의 권역은 높은 고도권(High-Elevation Zone), 중간 고도권(Mid-Elevation Zone), 낮은 고도권(Low-Elevation Zone)이라고 명명하였다.
3.2 권역별 특징 규명
군집분석 결과 대상지 북부와 남부가 명확히 서로 다른 권역으로 나타났으며, 낙동강을 따라 권역이 구분되었다. 산지가 많은 북서지역인 높은 고도권은 평균고도가 917.99 m이고, 기온이 6.63℃로 고도가 높고 기온이 낮게 나타났으며, 강수량은 148.91 mm로 다른 권역보다 상대적으로 많은 강수량을 보였다. 이와 반대로, 안동호가 있는 낮은 고도권은 평균고도가 257.34 m로 고도가 낮으며, 기온과 강수량은 각각 10.33℃와 86.49 mm로 기온이 높고 강수량이 적게 나타났다(Table 4).
본 연구에서는 환경부에서 제작한 중분류 토지피복도를 활용하여 연구대상지에서 토지사용이 어떻게 이루어지는지 분석하였다(Fig. 5). 대상지의 81%는 산림이 차지하고, 14%는 농업지역으로 이루어져 있어, 대상지의 대부분은 산림과 농업지역이었다. 특히, 농업지역 중 66%는 밭으로, 23%는 논으로 구성되어 있어, 물을 쉽게 관개할 수 있는 안동호 주변인 중간 고도권과 낮은 고도권에서 개간된 농경지가 많다는 것을 유추할 수 있었다. 한편, 높은 고도권의 농업지역 중 89%는 밭이었고, 중간 고도권의 71%는 밭으로, 20%는 논으로 구성되었으며, 낮은 고도권의 60%는 밭으로, 28%는 논으로 이루어져 있었다.
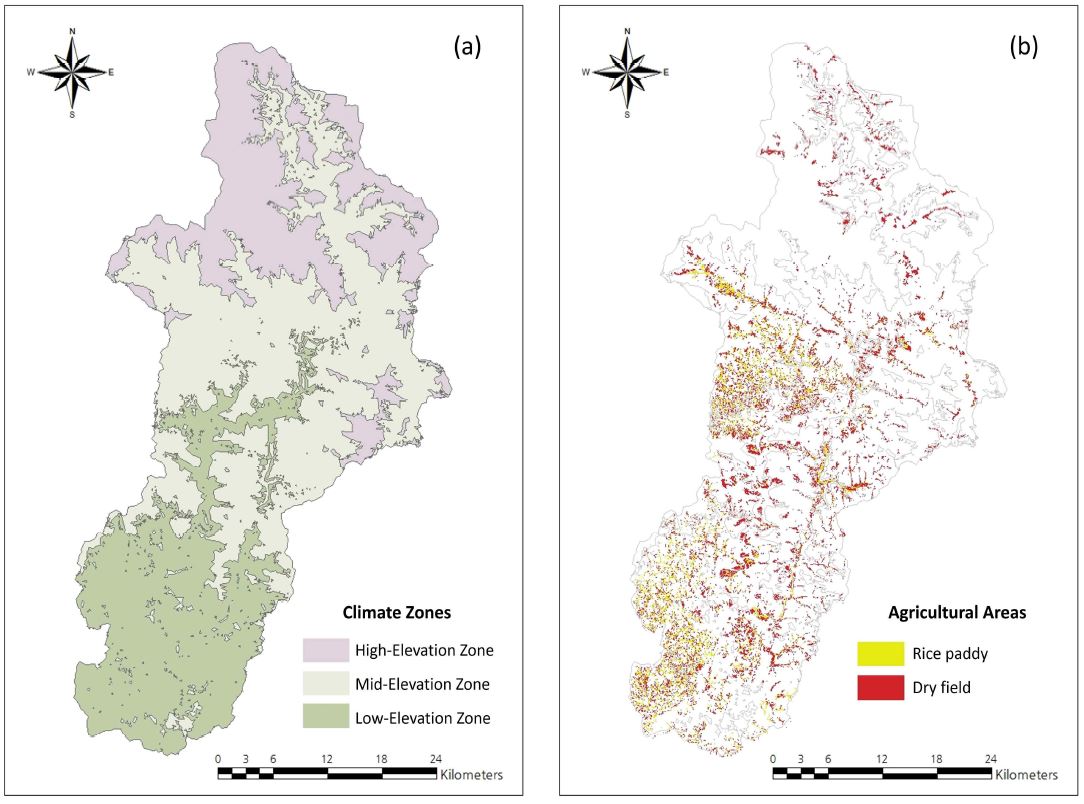
Characteristics of each climate zone using land cover map (Medium class). (a): Climate zones, (b): Agricultural areas.
또한, 3개로 구분된 대상지 각 권역의 토지피복도를 분석하였다(Table 5). 높은 고도권의 2%, 중간 고도권의 13%, 낮은 고도권의 20%는 농업지역으로 이루어져 있어, 대상지의 권역 중 낮은 고도권의 농업지역 비율이 가장 높았다. 대상지의 밭은 중간 고도권과 낮은 고도권에 각각 42%와 57%가 분포되어 있었고, 논은 각각 52%와 43%가 분포되어 있어 농업지역이 중간 고도권과 낮은 고도권에 집중되어 있음을 알 수 있었다.
본 연구에서는 산림청에서 제작한 1:25,000 축척의 5차 임상도를 활용하여 3개로 구분된 대상지 권역의 임상별 산림 면적을 파악하였다. 총 산림 면적은 131,484 ha이었으며, 그 중 활엽수림은 34,902 ha(27%), 침활혼효림은 35,349 ha(27%), 소나무림은 40,006 ha(30%), 낙엽송림은 13,719 ha(10%)를 차지하였다.
대상지 북쪽 산지 지역에는 활엽수림이 우세하고, 참나무림과 전나무림이 나타나는 특성을 보였다. 대상지 중부 지역에는 활엽수림, 침활혼효림, 소나무림, 그리고 낙엽송이 많은 부분을 차지하고 있었으며, 남쪽 지역에는 침활혼효림과 소나무림이 우세하였다. 이를 통해 권역별로 임상 분포가 뚜렷이 나뉘어 있는 것을 알 수 있었다(Fig. 6)
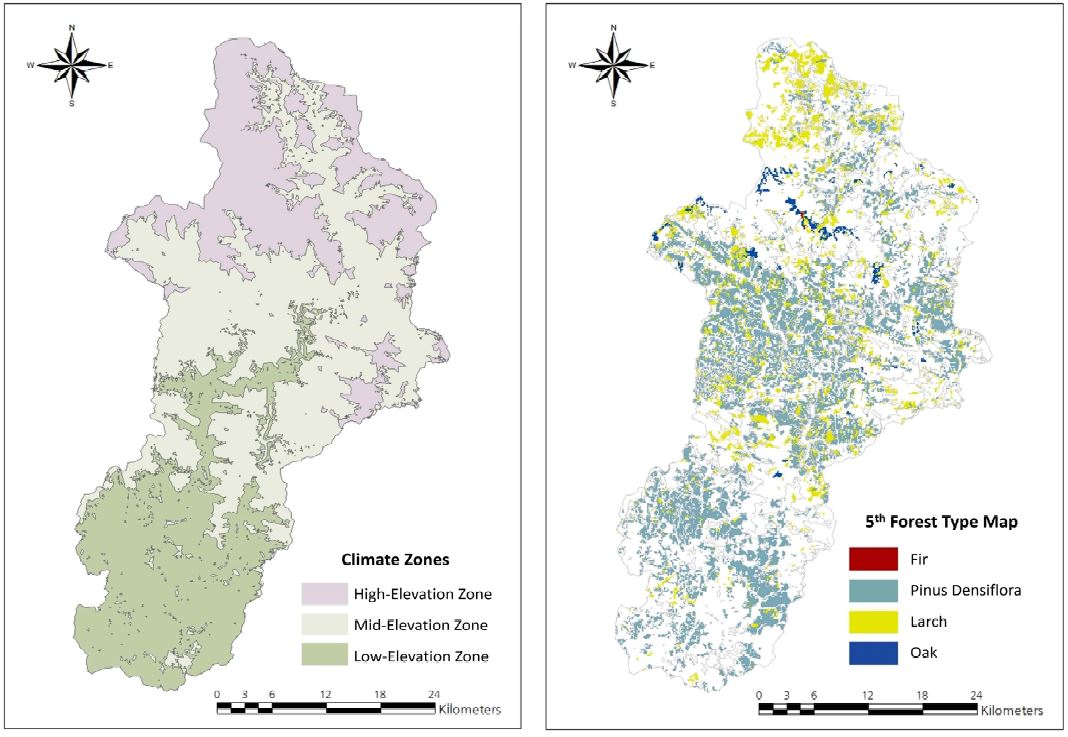
Tree species of each climate zone using 5th Forest Type Map. (a): Climate zones, (b): 5th Forest Type Map.
또한, 권역별로 임상도를 나누어 각 산림의 수종분포를 분석하고자 하였는데, 높은 고도권은 61%가 활엽수림이었으며, 참나무림과 전나무림의 89%와 95%가 높은 고도권에 집중되어 있어, 기온이 낮은 지역에 분포하는 수종을 고도가 높은 권역에서 확인할 수 있었다. 중간 고도권은 활엽수림과 침활혼효림이 각각 대상지의 36%와 42%를 차지하였으며, 소나무림의 57%가 분포되어 있었다. 또한 잣나무림이 중간 고도권의 55%를 차지하고 있었다. 낮은 고도권은 침활혼효림의 40%가 분포되어 있었고, 소나무림이 37%를 차지하는 특성을 보였다(Table 6).

5th Forest type of each climate zone (ha) (Ratio of forest type per subclass/Ratio of forest type per climate zone, n(%/%))
본 연구에서는 5차 임상도로부터 밀도의 정도를 면적으로 표시하였다. 대상지 북쪽과 중부 지역인 상, 중간 고도권은 대체로 밀도가 중간 정도였지만, 댐이 위치한 안동호 인근 낮은 고도권은 밀도가 높은 정도를 보였다.
영급에 관하여서는 북쪽 산지에서 안동호 쪽으로 갈수록 영급이 낮아지는 양상을 보였다. 높은 고도권에서 3, 4, 5영급의 임목이 우세하였으며, 중간 고도권에서는 3과 4영급의 임목이, 낮은 고도권에서는 2와 3영급의 임목이 지배적이었다.
경급에 관해 본 연구의 대상지 높은 고도권과 중간 고도권은 소경목과 중경목이 많았지만, 안동호 주변인 낮은 고도권에는 소경목이 두드러졌다(Fig. 7).
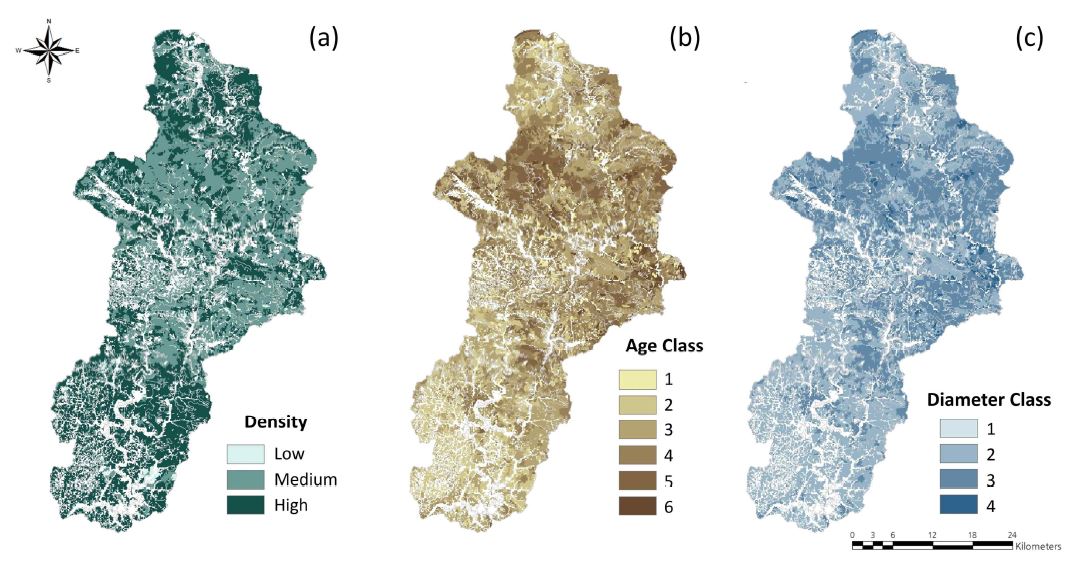
Characteristics of each climate zone using 5th Forest Type Map. (a): Density, (b): Age class, (c): Diameter class.
이를 수치로 표현하여 세 범위로 나눈 밀도를 보았을 때, 높은 고도권과 중간 고도권은 중간밀도가 각각 54%와 53%로 가장 많았고, 낮은 고도권은 높은 밀도가 74%로, 낮은 고도권에서 밀도가 가장 높은 양상을 보였다. 영급에 있어서는 4영급이 높은 고도권과 중간 고도권의 가장 많은 비율을 차지하였고, 3영급이 낮은 고도권의 가장 많은 비율을 차지하였다. 즉, 높은 고도권 산림의 59%와 중간 고도권의 산림의 67%가 3, 4영급으로 이루어져 있었고, 76%가 2, 3영급으로 이루어져 있어, 높은 고도권에서 낮은 고도권으로 갈수록 영급이 낮아지는 것을 확인할 수 있었다. 또한, 높은 고도권과 중간 고도권은 중경목이 가장 많았던 것에 반해, 높은 고도권, 중간 고도권, 그리고 낮은 고도권의 소경목의 비율은 각각 41%, 46%, 79%로 나타나, 낮은 고도권은 소경목이 가장 많은 비율을 차지하는 양상을 보였다(Table 7).
4. 결 론
본 연구는 국립기상과학원이 설치한 7개소의 수문기상관측소에서 측정된 기후, 지형, 수계에 해당하는 2013년과 2014년도 자료를 활용하여 유역단위의 기후권역을 구축하였다. 연구 방법으로 주성분분석과 Getis-Ord Gi* 공간통계를 이용하였으며, 그 결과 안동댐 유역을 3개의 군집으로 유형화 하였다. 기존의 연구와는 다르게 공간통계를 이용한 군집분석을 활용하여 변수의 분산 특성을 포함시킨 100 m×100 m 해상도의 기후권역이 구축되었다.
각 권역은 기온, 고도, 강수량, 토지피복, 그리고 임상 분포에서 특징이 구분되는 것으로 나타났다. 북쪽에 위치한 높은 고도권은 기온이 낮고, 고도가 높으며, 강수량이 많았다. 또한, 높은 고도권의 96%는 산림지역으로, 타 권역과 비교하여 가장 높은 산림의 비율을 차지하고 있었다. 활엽수림의 61%가 높은 고도권에 분포하였으며, 참나무림, 전나무림이 타 권역에 비해 많이 분포하는 특성을 보여, 기온이 낮은 지역에 서식하는 수종을 확인할 수 있었다.
중간에 위치한 중간 고도권은 기온, 고도, 강수량이 중간이었다. 중간 고도권의 산림비율은 82%이었고, 농업지역은 13%이었다. 침엽수림의 54%가 이 권역에 분포하고 있었으며, 활엽수림, 침활혼효림, 소나무림, 그리고 낙엽송이 많이 분포하는 특성을 보였다.
남쪽에 위치한 낮은 고도권은 기온이 높고, 고도가 낮으며, 강수량이 적었지만, 안동호가 위치하여 관개가 쉬우므로 권역의 20%가 농업지역으로 이루어져 있었다. 또한, 침활혼효림과 소나무림이 우세한 양상을 보였다.
기존의 생물기후권역 구축과 비교하여 본 연구는 상대적으로 좁은 지역에서 상세한 기후권역을 구축하고, 공간통계 기법을 활용하여 변수들의 분산 크기를 포함시키는 방법론을 제시하였다. 따라서 도출된 기후권역은 안동댐 주변의 생태계나 환경관리, 또는 기후변화 대응을 위한 의사결정이나 관련 정책 추진 등의 기반 자료로 활용될 수 있을 것으로 판단된다.
그러나 안동댐 건설 이전의 수문기상 자료는 본 연구에서 활용된 만큼 상세히 구축되어 있지 않았기에 댐 건설 전후의 수문기상을 직접적으로 비교하는 것에는 어려움이 있었다. 또한, 관측 지점의 수가 적은 한계가 있으므로, 향후 관측지점을 추가하여 정밀한 보간이 가능하도록 보완하여 기상 입력자료가 공간상 연속적으로 구성될 필요가 있다.
향후 연구에서 더 많은 지점의 자료와 오랜 기간의 자료를 구축하고, 기후권역의 전국화에 대하여 유효성을 검증한다면 환경관리 또는 기후변화 대응을 위한 의사결정이나 관련 정책 추진 등의 기반 자료로 사용하거나 농업이나 산림, 생태환경적 연구에서 다양한 방법으로 활용성을 높일 수 있을 것으로 사료된다.
Acknowledgments
본 연구는 국립기상과학원 “수문기상모델 개선을 위한 요소기술 개발(Ⅲ)”의 지원과 기상청 “기상See-At기술개발사업(KMIPA2015-6140)”의 지원으로 수행되었습니다.
REFERENCES
- Albert, DA, (1995), Regional landscape ecosystems of Michigan, Minnesota and Wisconsin: A working map and classification, Gen. Tech. Rep. NC-178, St. Paul, MN, U.S. Department of Agriculture, Forest Service, North Central Forest Experiment Station, p250.
- Alkaeed, O, Flores, C, Jinno, K, Tsutsumi, A, (2006), Comparison of several reference evapotranspiration methods for Itoshima Peninsula area, Fukuoka, Japan, Memoirs of the Faculty of Engineering, Kyushu University, 66(1), p1-14.
-
Bailey, RG, (1983), Delineation of ecosystem regions, Environmental Management, 7, p365-373.
[https://doi.org/10.1007/BF01866919]

-
Bailey, RG, (1987), Suggested hierarchy of criteria for multi-scale ecosystem mapping, Landscape and Urban Planning, 14, p313-319.
[https://doi.org/10.1016/0169-2046(87)90042-9]

-
Baxter, RM, (1977), Environmental effects of dams and impoundments, Annual Review of Ecology and Systematics, p255-283.
[https://doi.org/10.1146/annurev.es.08.110177.001351]

-
Beven, KJ, Kirkby, MJ, (1979), A physically based, variable contributing area model of basin hydrology/Un modèle à base physique de zone d'appel variable de l'hydrologie du bassin versant, Hydrological Sciences Journal, 24(1), p43-69.
[https://doi.org/10.1080/02626667909491834]

-
Bren, LJ, O’Neill, IC, Gibbs, NL, (1988), Use of map analysis to elucidate flooding in an Australian riparian river red gum forest, Water Resources Research, 24, p1152-1162.
[https://doi.org/10.1029/WR024i007p01152]

-
Bren, LJ, (1992), Tree invasion of an intermittent wetland in relation to changes in the flooding frequency of the River Murray, Australia, Australian Journal of Ecology, 17, p395-408.
[https://doi.org/10.1111/j.1442-9993.1992.tb00822.x]

- Cadwallader, PL, (1986), Flow regulation in the Murray River system and its effect on the native fish fauna, Stream protection: The management of rivers for instream uses, Water Studies Centre, Chisholm Institute of Technology, East Caulfield, Australia, (as cited in Gordon et al. 1992) p115-34.
- Choi, M, Sur, CY, Kim, SD, Park, Y, (2013), Vulnerability of hydrology ecological systems due to climate change in Korea. Special Issue 03. International Hydrological Program, Magazine of Korea Water Resources Association, 46(4), p42-45.
- Cleland, DT, Crow, TR, Avers, PE, Probst, JR, (1992), Principles of land stratification for delineating ecosystems. Taking an ecological approach to management, Taking an ecological approach to management, US Forest Service Watershed and Air Management, p40-50.
-
Dibike, YB, Coulibaly, P, (2005), Hydrologic impact of climate change in the saguenay watershed: Comparison of downscaling methods and hydrologic models, Journal of Hydrology, 307, p145-163.
[https://doi.org/10.1016/j.jhydrol.2004.10.012]

-
Getis, A, Ord, JK, (1992), The analysis of spatial association by use of distance statistics, Geographical Analysis, 24(3), p189-206.
[https://doi.org/10.1111/j.1538-4632.1992.tb00261.x]

- Getis, A, Ord, JK, (1996), Local spatial statistics: An overview. Spatial analysis: modelling in a GIS environment, Cambridge, p261-277.
-
Hargreaves, GH, Samani, ZA, (1985), Reference crop evapotranspiration from temperature, Applied Engineering in Agriculture, 1(2), p96-99.
[https://doi.org/10.13031/2013.26773]

-
Hargreaves, GH, (1994), Defining and using reference evapotranspiration, Journal of Irrigation and Drainage Engineering, 120(6), p1132-1139.
[https://doi.org/10.1061/(ASCE)0733-9437(1994)120:6(1132)]

- Harrison, PA, Berry, PM, Dawson, TP (Eds.), (2001), Climate change and nature conservation in Britain and Ireland: Modelling natural resource responses to climate change (the MONARCH project), UK Climate Impacts Programme ISO 690.
-
Heckler, CE, (1996), A step-by-step approach to using the SASTM system for factor analysis and structural equation modeling, Technometrics, 38(3), p296-297.
[https://doi.org/10.1080/00401706.1996.10484524]

- Hong, KO, Suh, MS, Rha, DK, Chang, DH, Kim, C, Kim, MK, (2007), Estimation of high resolution gridded temperature using GIS and PRISM (in Korean with English abstract), Atmosphere, 17(3), p255-268.
-
Hossell, JE, Riding, AE, Brown, I, (2003), The creation and characterisation of a bioclimatic classification for Britain and Ireland, Journal for Nature Conservation, 11(1), p5-13.
[https://doi.org/10.1078/1617-1381-00033]

-
Host, GE, Polzer, PL, Mladenoff, DJ, White, MA, Crow, TR, (1996), A quantitative approach to developing regional ecosystem classifications, Ecological Applications, p608-618.
[https://doi.org/10.2307/2269395]

- Jeong, GY, Yang, HM, Kim, SK, Park, SJ, (2012), Ecoregion classification using multi-hierarchy of environmental factors (in Korean with English abstract), Journal of the Korean Geographical Society, 47(5), p654-676.
- Ji, U, Hwang, MH, Lim, KS, Kang, SU, (2012), Analysis of watershed characteristics and land use of four major rivers using GIS (in Korean), Water for Future. Magazine of Korea Water Resources Association, 45(10), p26-33.
- Johnson, LB, Host, GE, Jordan, JK, Rogers, LL, (1991), Use of GIS for landscape design in natural resource management: Habitat assessment and management for the female black bear, GIS/LIS'91, Atlanta, GA, USA, 10/28-11/01/91, p507-517.
-
Johnson, WC, Burgess, RL, Keammerer, WR, (1976), Forest overstory vegetation and environment on the Missouri River floodplain in North Dakota, Ecological Monographs, 46, p59-84.
[https://doi.org/10.2307/1942394]

- Jolly, ID, (1996), The effects of river management on the hydrology and hydroecology of arid and semi-arid floodplains, Floodplain Processes, p577-609.
- Jordan, JK, (1982), Application of an integrated land classification, Proceedings, Artificial regeneration of conifers in the Upper Lakes Region, p26-28.
-
Kaiser, HF, (1960), The application of electronic computers to factor analysis, Educational and Psychological Measurement, 20, p141-151.
[https://doi.org/10.1177/001316446002000116]

-
Kelly-Hope, LA, Hemingway, J, McKenzie, FE, (2009), Environmental factors associated with the malaria vectors Anopheles gambiae and Anopheles funestus in Kenya, Malar J, 8(268), p1-8.
[https://doi.org/10.1186/1475-2875-8-268]

-
Kemenes, A, Forsberg, BR, Melack, JM, (2007), Methane release below a tropical hydroelectric dam, Geophysical Research Letters, 34(12).
[https://doi.org/10.1029/2007GL029479]

-
Khaliq, MN, Ouarda, TBMJ, Ondo, JC, Gachon, P, Bobee, B, (2006), Frequency analysis of a sequence of dependent and/or non-stationary hydro-meteorological observations: A review, Journal of Hydrology, 329, p534-552.
[https://doi.org/10.1016/j.jhydrol.2006.03.004]

- Kim, MJ, (2014), Spatial agglomeration pattern analysis using getis-ord’s Gi* and FLQ: In case of knowledge-based industries in Gyeonggi province, Journal of the Korean Cartographic Association, 14(1), p107-123.
- Kim, TK, Yoo, BH, Kim, MJ, Yang, BG, Lee, JY, Lee, JH, Lee, SM, Kim, KD, (2007), Assessments of ecosystems sensitive to climate change(I): with emphasis on bioclimatic classification (in Korean with English abstract), National Institute of Environmental Research, p1-43.
-
Kingsford, RT, (2000), Ecological impacts of dams, water diversions and river management on floodplain wetlands in Australia, Austral Ecology, 25(2), p109-127.
[https://doi.org/10.1046/j.1442-9993.2000.01036.x]

-
Le Gallo, J, Ertur, C, (2003), Exploratory spatial data analysis of the distribution of regional per capita GDP in Europe, 1980-1995, Regional Science, 82(2), p175-201.
[https://doi.org/10.1111/j.1435-5597.2003.tb00010.x]

- Lee, MA, Lee, WK, Song, CC, Lee, JH, Choi, HA, Kim, TM, (2007), Spatio-tempers change prediction and variability of temperature and precipitation (in Korean with English abstract), Journal of Korea Spatial Information Society, 15(3), p267-278.
- Lee, SC, Choi, SH, Lee, WK, Yoo, SJ, Byun, JG, (2011), The effect of climate data applying temperature lapse rate on prediction of potential forest distribution (in Korean with English abstract), Journal of Korean Society for Geospatial Information System, 19(2), p19-27.
- Lee, SI, Cho, DH, Sohn, HG, Chae, MO, (2010), A GIS-based method for delineating spatial clusters: A modified AMOEBA technique, Journal of the Korean Geographical Society, 45(4), p502-520.
-
Maingi, JK, Marsh, SE, (2002), Quantifying hydrologic impacts following dam construction along the Tana River, Kenya, Journal of Arid Environments, 50(1), p53-79.
[https://doi.org/10.1006/jare.2000.0860]

-
Matthews, CJ, Joyce, EM, Louis, VLS, Schiff, SL, Venkiteswaran, JJ, Hall, BD, Bodaly, RA, Beaty, KG, (2005), Carbon dioxide and methane production in small reservoirs flooding upland boreal forest, Ecosystems, 8(3), p267-285.
[https://doi.org/10.1007/s10021-005-0005-x]

-
Mintz, Y, Walker, GK, (1993), Global fields of soil moisture and land surface evapotranspiration derived from observed precipitation and surface air temperature, Journal of Applied Meteorology, 32(8), p1305-1334.
[https://doi.org/10.1175/1520-0450(1993)032<1305:GFOSMA>2.0.CO;2]

-
Nalder, IA, Wein, RW, (1998), Spatial interpolation of climatic normals: Test of a new method in the Canadian boreal forest, Agricultural and Forest Meteorology, 92(4), p211-225.
[https://doi.org/10.1016/S0168-1923(98)00102-6]

- NIMR, (2013), Advanced research on hydrometeorology research, advanced research on applied meteorology (I), National Institute of Meteorological Research, No. 11-1360395-000448-01.
-
Omernick, JM, (1987), Ecoregions of the conterminous United States, Annals of the Association of American Geographers, 77, p118-125.
[https://doi.org/10.1111/j.1467-8306.1987.tb00149.x]

-
Ord, JK, Getis, A, (1995), Local spatial autocorrelation statistics: Distributional issues and an application, Geographical Analysis, 27(4), p286-306.
[https://doi.org/10.1111/j.1538-4632.1995.tb00912.x]

-
Park, JH, Lee, GS, Yang, JS, Kim, SW, (2012), A hydrometeorological time series analysis of Geum River watershed with GIS data considering climate change, Journal of Korea Spatial Information Society, 20(3), p39-50.
[https://doi.org/10.12672/ksis.2012.20.3.039]

- Rauscher, HM, (1984), Homogeneous macroclimatic regions of the Lake States, US Forest Service Research Paper NC-240.
-
Richter, BD, Baumgartner, JV, Wigington, R, Braun, DP, (1997), How much water does a river need?, Freshwater Biology, 37, p231-249.
[https://doi.org/10.1046/j.1365-2427.1997.00153.x]

- Sang, LJ, (2002), A study on the classification of regional patterns by cluster analysis utilizing factor scores (in Korean with English abstract), Journal of the Korea Planners Association, 37(4), p191-200.
-
Schulze, MB, Hoffmann, K, Kroke, A, Boeing, H, (2003), Risk of hypertension among women in the EPIC-Potsdam study: Comparison of relative risk estimates for exploratory and hypothesis-oriented dietary patterns, American Journal of Epidemiology, 158(4), p365-373.
[https://doi.org/10.1093/aje/kwg156]

-
Scott, ML, Auble, GT, Friedman, JM, (1997), Flood dependency of cottonwood establishment along the Missouri River, Montana, USA, Ecological Applications, 7, p677-690.
[https://doi.org/10.1890/1051-0761(1997)007[0677:FDOCEA]2.0.CO;2]

-
Smith, CD, (2008), The relationship between monthly precipitation and elevation in the Alberta foothills during the foothills orographic precipitation experiment, In Cold Region Atmospheric and Hydrologic Studies, The Mackenzie GEWEX Experience, Springer Berlin Heidelberg, p167-185.
[https://doi.org/10.1007/978-3-540-73936-4_10]

- Sneath, PH, Sokal, RR, (1973), Numerical taxonomy, The principles and practice of numerical classification, W. H. Freeman and Co., San Francisco.
-
Toner, M, Keddy, P, (1997), River hydrology and riparian wetlands: A predictive model for ecological assembly, Ecological Applications, 7, p236-246.
[https://doi.org/10.1890/1051-0761(1997)007[0236:RHARWA]2.0.CO;2]

- United States, Forest Service, Huron-Manistee National Forest, (1993), Field guide: Ecological classification and inventory system of the Huron-Manistee National Forests, United States Department of Agriculture, Forest Service.
- Yun, JI, Choi, JY, Yoon, YK, Chung, U, (2000), A spatial interpolation model for daily minimum temperature over mountainous regions (in Korean with English abstract), Korean Journal of Agricultural and Forest Meteorology, 2(4), p175-182.
- Yun, JI, Choi, JY, Ahn, JH, (2001), Seasonal trend of elevation effect on daily air temperature in Korea (in Korean with English abstract), Korean Journal of Agricultural and Forest Meteorology, 3(2), p96-104.
