IoT 모니터링 시스템을 통한 기후변화 취약계층 지원 차열사업의 효과 분석 : 김해시 진영읍 주거지역을 사례로
 ; Kim, LeeKyung**
; Park, YeJin**
; You, DaYeon**
; Zoh, Hyunmin Daniel***
; Lim, Young Shin****, †
; Kim, LeeKyung**
; Park, YeJin**
; You, DaYeon**
; Zoh, Hyunmin Daniel***
; Lim, Young Shin****, †
Abstract
The effects of climate change are widespread globally, and emerging as a threat to vulnerable groups including the elderly, children, and low-income households living in cities. In Korea, The Ministry of Environment has been carrying out a national project to support climate-vulnerable groups by applying cooling systems like cool roofs, cool walls, and shading systems. Measuring the effectiveness of these cooling projects through an appropriate monitoring methodology became more important, as cooling projects have gained huge attention. This study examines the effectiveness of the cooling project applied in the residential area of Jinyeong-eup, Gimhae-si, Gyeongsangnam-do, where most of the residents are elderly people who are vulnerable to heatwaves and intense heat. To measure temperature changes, a data logger and self-developed IoT equipment were installed on the roofs and indoors. Also, a survey was conducted to measure the resident satisfaction with the cooling project. The results are as follows. First, a significant temperature reduction was found in housing where both cool roof and cool wall were applied compared with non-applied housing. The average temperature difference between combined applied housing and non-applied housing was 3.42°C for the roof surfaces. Also, the survey results suggested that most residents were satisfied with the cooling project itself and felt the changes in indoor temperature.
Keywords:
Cool Roofs, Cool Walls, IoT-based Heat Measurement, Climate-vulnerable Groups1. 서론
기후변화의 영향은 전세계적으로 광범위하게 나타나고 있으며, 지구온난화에 따른 연평균 기온 상승, 이상기후 증가, 물부족, 빈곤 등이 지역별로 상이하게 발생하는 등 도시의 지속가능성에 위협으로 작용하고 있다 (Kim, 2021). 이와 같은 기후변화에 따른 영향에 대비하기 위해 전세계적으로 다양한 기술들이 개발되고 정책적으로 적용되고 있다. 특히 건축물의 지붕 또는 외벽면에 도달하는 과다한 일사량으로 인해 냉방부하가 크게 증가하며, 이는 에너지 소비증가와 함께 거주자의 냉방 쾌적도를 저하시키고 동시에 도시열섬 현상의 원인으로 발생하고 있어 건축물의 지붕 또는 외벽 표면에서의 일사량 조절 등 도달하는 열의 반사율을 높일 경우 표면온도 저감에 따른 열성능 향상이 가능하다(ME, 2021). 이를 위해 미국, 일본 등 해외 선진국에서는 2000년대 초반부터 폭염 현상 완화를 위한 전략으로 건조환경 및 인공포장·구조물에 차열기술을 적용하는 사업을 주요 대책으로 제시하고, 실증기반의 연구개발 및 성능기준을 마련하여 시행 중에 있다(Park et al., 2017).
최근 우리나라에서도 환경부와 한국환경연구원 국가기후위기적응센터를 중심으로 기후변화에 따른 폭염현상에 대응하기 위하여 쿨루프, 쿨페이브먼트, 쿨링포그, 쿨링&클린로드, 벽면녹화 등의 폭염대응시설을 적용하는 기후변화 적응사업 모델을 구축·확산 중에 있으며 기술·유형별 적용에 따른 사업효과 및 문제점을 검토·분석하여 대응시설별 실효성을 제고 중에 있다(Lim et al., 2021).
특히 기후변화에 크게 영향을 받는 취약한 시설과 개별 취약가구를 대상으로 열차단(heat blocking) 기능의 차열공법 및 소재를 적용하는 쿨루프, 쿨월사업을 통해 여름철 열쾌적성 향상으로 인한 기후변화 취약계층의 건강피해 예방과 함께 건축물의 에너지 효율(냉방부하 저감)을 증대하고 있다.
이와 같은 차열사업이 확대되면서 적용하는 시설·재질 및 대상에 따른 사업 전·후의 실내·외 온도변화를 실시간/장기간으로 측정하고, 사업으로 인한 거주자의 체감도와 문제점 등을 검증·환류하기 위한 모니터링 방법론을 마련하여 사업의 효과를 정밀 분석하고 실효성을 제고하기 위한 필요성이 더욱 대두되고 있다.
이에 한국환경연구원 국가기후위기적응센터는 서울대학교 환경대학원 연구팀과 함께 환경부의 “2021년 기후변화 취약계층 지원사업” 유형1)으로 추진한 차열사업(쿨루프, 쿨월)을 대상으로 사업특성을 고려한 모니터링 및 효과분석 방법론을 마련하여 모니터링을 통한 사업 전·후의 효과를 측정·분석하였다.
본 논문은 이에 대한 연구 결과로써 차열사업을 수행한 지역들 중에서 경상남도 김해시 진영읍 일대 개별 취약가구에 적용한 차열사업(쿨루프·쿨월 적용 및 비적용 가구)을 대상으로 IoT 모니터링 장비와 데이터로거를 설치하여 차열사업 적용 유형별로 사업 전·후의 온도 변화를 실시간/장기간 측정하고 취약 거주민의 체감도와 만족도를 분석하여 기후위기 대응 취약계층의 피해예방과 폭염적응 시설개선을 위한 기후탄력성을 강화하고자 하였다.
2. 연구자료 및 방법
2.1 사업 대상지(김해시 진영읍) 현황 및 특성
본 연구의 공간적 범위는 경상남도 김해시 진영읍 일대 61개 소에 기후변화 취약계층 지원사업으로 열차단 기능의 차열페인트를 적용한 가구 중 총 2곳(벽 차열도장 가구, 지붕 및 벽 차열도장 가구) 가구와 대조군으로 차열을 적용하지 않은 일반가구를 대상지로 하였다. 시간적 범위는 본 연구의 연구기간은 2021년 8월부터 2022년 1월까지이며, 모니터링 장비를 통한 데이터 측정 및 분석은 2021년 7월에서 2022년 1월까지로 3곳 대상지에 대한 모니터링을 실시 하였다. 한편 장비를 통한 데이터 수집 및 측정이 폭염 기간에 해당하는 여름철인 6 ~ 7월에 비해 다소 늦게 진행되어, 8월 말부터 본격적인 IoT장비 투입과 데이터 측정이 진행되었고 이에 측정기간 중 가장 기온이 높았던 일자를 기준으로 분석이 진행되었다.
거주민의 체감도와 만족도를 위한 설문조사는 전체 적용 가구 61가구를 대상 중 응답이 가능한 30가구를 대상으로 하여 2021년 10월부터 11월까지 실시하였으며 설문조사와 함께 연구를 진행하는 과정에서 일부 가구들을 대상으로 심층인터뷰를 병행하였다. 내용적 범위는 21년 기후변화 취약계층 지원 차열사업(지붕 및 외벽 페인팅) 대상지역에 해당하는 경남 김해시의 차열사업 열저감 효과 모니터링 및 데이터 분석을 실시하였다. 온도측정 조사 대상지는 벽 차열도장 가구, 지붕 + 벽면 차열페인트 복합 적용가구, 미적용 가구로 나누어 선정하였으며 차열적용이 지원된 가구 61개소 중, 특성과 구조 등을 살펴보고 유사지역 및 건물을 조사하여 대표 가구 2개소와 비교대상지로 적용하지 않은 일반가구를 선정하였다. 또한 관련 연구논문 등 문헌검토를 통해 조사항목(일반현황, 기후현황, 대상지 특성, 취약성, 적응여건, 이용현황 등)을 결정하고 조사를 수행하였다. 마지막으로 차열 페인팅 대상건물의 건축적 현황 및 주변의 미시기후 요소 등을 고려하여 구체적 현황을 파악하고 열차단 페인팅 적용 후, 적용 건물과 비적용 건물 입면 표면온도 및 현황을 파악하였다.

Vulnerable class supporting project monitoring target
경상남도 김해시 진영읍은 창원시에 이어 경상남도에서 인구가 많은 도시로 행정 구역에 해당하며 1개의 읍, 6개의 면, 12개의 동으로 구성되어 있다. 김해시 면적은 총 463.3 km²로 경남의 4.4%로 해당하며 진영읍은 그 중 39.67 km² 면적을 차지하고 있다. 경상남도의 기후는 동남단(저위도)에 위치하여 있으며 겨울의 찬 서북풍을 막아주는 북서쪽 높은 산맥의 영향으로 전체적으로 온화한 편이며, 김해시는 온대기후지역으로 4계절 구분이 뚜렷하고 남해의 해양성 기후 영향을 많은 지역으로 전국에서 온화한 기후에 속한다. 최근 10년간 연평균 기온은 15.1℃로 우리나라 평균 기온 1℃보다 2℃가량 높고, 평균 강수량은 1,276 mm로 우리나라 평균 강수량 1,277 mm와 유사하다.
김해시 기후변화 취약계층 지원사업 차열사업 모니터링 기간인 2021년 8월 26일에서 2021년 10월 11일 사이 모니터링 기간 동안의 기온은 최고 기온은 8월 37.5℃이며, 최저 기온은 23.9℃로 나타났다. 또한 김해시의 습도는 최고 99.9%이고 최저 41.2%로 확인되며, 풍속은 최대 15.8 m/s로 확인되었다. 누적강수량은 최대 36 mm이며, 일사량과 일조량의 경우는 각각 최대 23.2 MJ/㎡, 36650 Sec로 확인되었다.
2.2 문헌 및 선행연구 고찰
본 연구와 관련된 국내의 선행연구 검토로 차열페인트와 관련된 연구를 중심으로 검토하였다. 국내외 선행연구들은 쿨월, 쿨루프를 통한 열저감 효과, 열환경 개선방안, 실내외 온도 저감 등에 대한 온도저감 평가와 열환경 개선을 위한 방법에 대한 고찰이 중심이 되어있다. Table 2, Table 3에 이를 정리하였다. 대체적으로, 기존 연구들은 데이터로거를 사용하여 짧은 기간 동안 열관류량과 온도 측정, 쿨루프의 열적특성을 측정하였고, 열적외선 카메라등을 활용하여 여름철 온도변화 특성을 지붕 재질별로 측정하였다. 본 연구는, 실시간 기반 IoT 클라우드 컴퓨팅을 사용하여 건물의 실외와 실내를 동시에 측정하여 차열페인트에 대한 효과를 분석한 부분을 차별화하였다.
A domestic study on the heat reduction effect of cool roof and cool wall
Overseas study on heat reduction effect and research methodology of insulation paint
2.3 체감온도와 불쾌지수
본 연구에서는 차열사업에 대한 거주민들의 체감효과를 살펴보기 위하여 측정된 데이터를 바탕으로 체감온도와 불쾌지수를 측정하였다. 관련된 수식과 내용은 다음과 같다.
체감온도란 외부에 있는 사람이나 동물이 바람과 한기에 노출된 피부로부터 열을 빼앗길 때 느끼는 시원한 정도를 나타내는 지수이다(Park et al., 2005). 2001년 8월 캐나다에서 열렸던 JAG/TI (Joint Action Group for Temperature Indices) 회의에서 새롭게 발표된 방식을 채택하여 사용하고 있다(Park et al., 2005).
모니터링으로 수집된 기온과 기상청에서 수집된 풍속데이터를 이용하여 차열페인트 적용지와 비적용지의 체감온도차이를 이용, 열쾌적성 지수를 비교하였고 이에 관한 수식은 (1)과 같다.
| (1) |
- S: Sensible Temp.
- T: Temperature (Celsius)
- V: wind speed (Km/h)
- Formula 1. Formula for sensible temperature according to the temperature and wind speed of the cool paint target area
불쾌지수는 미국의 기후학자 톰(E. C. Thom)이 1957년에 제창한 것으로 체감기후를 나타내는 지수이며 온·습도 지수 라고도 부른다(Lee et al., 2013). 이는 기온과 습도만의 조합으로 구성되어 있기 때문에 여름철 실내의 무더위를 알아보는 기준으로 사용되고 있다.
습구온도를 관측되지 않는 기상관서에서는 수식 (2)를 이용하여 계산한다. 불쾌지수(DI)는 날씨에 따라 사람이 불쾌감을 느끼는 정도를 기온과 습도를 조합하여 나타낸 수치로 모니터링으로 수집된 기온과 기상청에서 수집된 습도 데이터를 이용하여 적용지와 비적용지의 불쾌지수를 측정하여 열쾌적성을 비교하는데 사용한다. 수식은 (2)와 같다.
| (2) |
- DI: Discomfort Index
- T : Temperature (Celsius)
- RH : relative humidity (%)
- Formula 2. Formula for sensible temperature according to the temperature and wind speed of the target site
2.4 모니터링 대상 사업지역 선정
모니터링 대상지로 선정된 경상남도 김해시 진영읍 진영산복로 일대는 경상남도 김해시 진영읍 진영리 부곡IC삼거리에서 출발하여 여래리에서 끝나는 도로 남쪽에 산을 끼고 있고 최근 도시재생을 한 구도심으로, 여름철 폭염에 약한 구옥으로 구성되어 있어 기후변화 취약계층이 많이 거주하는 지역이다. 대상지 선정기준은 구조·형태(층수/방/거실 등), 건축물 두께, 실내외 면적, 거주인원, 환기 및 냉난방시설 등 고려하였다.
Fig. 1의 구글어스엔진을 통해서 살펴본, 2021년 진영읍 산복로 주변 1 km 구간의 평균온도의 변화와 낮과 밤의 온도 변화차를 보여준다. 그래프를 통해서, 여름철 고온이 6월 ~ 9월까지 유지되며, 폭염이 지속되는 8월, 9월에 주간시간을 집중적으로 모니터링하는 것으로 결정하였다.

Average temperature in the area of Sanbok-ro, Jinyeong-eup in 2021 analyzed by Google Earth engine(Source: Google Earth Engine)
3 monitoring sites for the cool painting projects
Fig. 2, Fig. 3에서 동일구역 내 유사건물·환경조건반 비적용 대조군(1곳)과 적용 실험군(쿨월 적용지/쿨루프 +쿨월 복합적용지 등 2곳)으로 구분하였다.

Location of monitoring target site and land use plan for heat shielding project
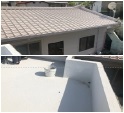
(1) 대상지 1: 쿨루프 쿨월 복합 적용가구
대상지 1에 해당하는 쿨루프 쿨월 복합 적용가구는 건축물 1층 단층으로 이루어져 있으며, 일사량이 가장 높은 해당지에 해당한다.
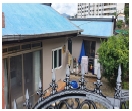
(2) 대상지 2: 쿨월 적용가구
대상지 2의 쿨월 적용가구는 슬레이트 지붕에 해당하여 복사열이 높은 환경적 특성을 가지고 있다. 주택이 그늘진 음지에 위치하고 있어 다른 3가구에 비해 대기온도가 비교적 낮은 편에 해당한다.
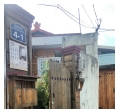
(3) 대상지 3: 비적용 가구
대상지 3은 차열사업 비적용 가구이다.
본 연구에 대한 실질적인 이용자들의 체감 및 만족도를 조사하기 위해 경상남도 김해시 진영읍 차열사업 지원사업 대상지를 중심으로 설문조사를 실시하였다. 설문조사 대상은 2021년에 지원한 김해시 진영읍 차열사업 지원가구를 대상으로 실시하였으며, 조사기간은 2021년 10월 25일에서 2021년 11월 8일이다.
설문 조사내용은 거주자의 체감효과, 시공·품질 등 만족도, 사후관리 등 차열사업 지원에 따른 체감효과 및 만족도에 대한 부분을 중심으로 하였다. 설문조사에 대한 총 응답자는 30명으로 응답자 정보 및 차열사업 현황, 차열페인트 적용 후 체감효과, 차열페인트 시공품질·관리 만족도, 차열페인트 지원사업에 대한 건의사항 등을 중심으로 조사하였다. 응답자 정보 및 차열사업의 기본현황은 응답자의 성별, 연령대, 주소, 차열사업의 종류, 주거환경이 중심이 되었다. 차열페인트 적용 후 체감효과에서는 시공 이전 및 이후에 대한 실내온도 체감 변화, 체감효과 요인 중심이 되었다. 차열페인트 시공품질·관리 만족도에서는 차열페인트 색상, 공사일정 및 과정, 페인트 품질, 시공 후 문제점, 전반적인 만족도 및 불만족 이유, 차열페인트 관리 여부, 개선사항들에 대한 부분이 주가 되었다.
3. 결과 및 고찰
3.1 모니터링 계획수립
사업 적용 대상지 현황 및 여건조사 결과를 바탕으로 사업유형별 모니터링 방법 및 세부사항 결정을 하였다. 우선적으로 기후변화 취약가구 중 차열페인트 시공이 이루어진 곳을 선별하고, 도면 등을 활용한 건축적 구조 분석을 통해 대조군이 될 수 있는 비슷한 공간 구조의 비 시공 가구를 선정하였다. Fig. 3에서와 같이 외벽에만 적용한 가구, 지붕과 외벽에 적용한 가구, 차열페인트가 적용되지 않은 가구, 각각의 사업 유형에 맞는 모니터링 장비의 종류와 설치 위치에 대한 계획을 수립하였다.

Criteria for selecting a target site for monitoring the cool painting project
(1) 데이터 모니터링 상세계획
데이터 모니터링 항목 및 방법은 Table 5와 같다.
Thermal insulation project monitoring plan details
(2) 데이터 모니터링 장비 개발
모니터링 대상 지점을 선정하여, 실외는 데이터 로거와 실내에는, IoT 센서를 이용하여 적용가구와 비적용가구를 모니터링 수행하였다.
데이터의 수집과 모니터링을 위하여 시중의 온·습도계와 데이터 로거 등을 검토하였으나, 기존의 장비로는 동시 간에 온·습도를 센싱 위치에 따라서 다중채널로 측정하고 같은 시계열 데이터로 저장하는 것은 불가능하였다. 또한 측정지역의 인터넷 환경 등이 열악하여 측정 기기 자체적으로 무선 인터넷이 지원되면서, 데이터의 수집과 관리가 용이한 CSV포맷으로 파일이 저장되는 것이 필요하였다. 또한 본 연구에서는 측정 간격을 10초에서 20초 단위 등으로 측정하여 다수의 정교한 데이터를 수집하고자 하였기 때문에 시중에 개발되어 있는 데이터 로거로는 데이터의 수집과 모니터링이 어려웠다. 이에 본 연구에서는 Fig. 4와 같은 별도의 하드웨어를 직접 개발하여 적용하였다. 데이터의 저장 공간은 클라우드 서버를 사용하여 1년 이상의 장기적인 모니터링에서도 용량의 문제 없이 수행이 가능하도록 설계하였다.

Monitoring IoT hardware and complete block diagram
기존 사용되었던 범용 데이터로거 대비 자체 개발한 IoT 장비의 차별점은 아래의 Table 6과 같다. 자체 개발한 IoT 장비 가장 큰 장점은 실시간으로 다수의 온·습도 수집함과 동시에 다양한 공기질 관련 시계열 데이터를 동일 타임 스템프를 데이터로 동시에 저장하기 때문에, 별도의 후처리 없이 추후 기계학습 트레이닝과 빅데이터 처리에 바로 사용할 수 있는 점에 있다.
Comparison of IoT devices and data loggers
본 연구에서는 측정을 위해 IoT 장비 외에 표면온도계, 온·습도계, 데이터로거, 열화상카메라가 사용되었다. 이와 같은 장비들을 통하여 설계항목들을 기준으로 Fig. 5와 같이 측정을 진행하였다. 구체적인 측정 방법은 아래와 같다.

Site monitoring methods
- ▶ 측정사항: ①, ②
① (실외-단기측정) 데이터 로거 기반, 조성 후 또는 대조군 기반 지붕표면온도, 지붕면 대기온도(G·L :1.5 m), 당일 기온·습도·풍속(21년 8월 26일 ~ 10월 11일) 매 10분단위 24시간 지속 체크
② (실내-장기측정) 온도변화(대기, 천장면, 외벽면) / 당일 기온·습도·풍속
- ▶ 측정위치: Fig. 5
- ▶ 측정기간: 21년 8월 26일 ~ 22년 1월, 약 5개월
- ▶ 측정주기: 24시간, 매 20초/1회

Installation of external data logger equipment in combined application, cool wall application, and non-applied household

Combined painting, cool wall painting, non applied house – indoor IoT equipment installation
3.2 모니터링 수행
실내 장비 설치의 경우 외부요소와 내부 냉·난방기, 공기조향장치 등의 영향을 받지 않는 곳을 선정하였다. 거실은 실제로 노인들이 오후 활동을 하는 공간이며, 에어컨이나 선풍기가 안방에 위치하고 있어서 차열페인트의 효과가 가장 직접적으로 관측할 수 있는 곳이기 때문에 해당 위치에 설치하였다.
데이터로거는 자체 개발한 IoT 장비와 비교하여 데이터의 손실이나 이상동작(malfunction)에 대한 부분을 실시간으로 확인하기 어려워 우천시 방수에 취약하다. 이러한 부분을 보강하기 위하여 외부에 로거를 보관하여 운영할 수 있는 야외용 함체를 설계하여 배치하였다. 한편, IoT장비는 실외에 설치 부분에 있어서 전원과 와이파이 등에 연결되어야 하기 때문에, 실외 설치가 쉽지 않아 본 연구에서는 실외에는 데이터로거를 설치하였다.
실외 설치위치는 각 데이터로거당 2개의 온도센서를 부착하여 하나는 1.5 m 상부에 설치하고 나머지 하나는 바닥면에서 10 cm 높이에 설치하였으며, 이를 통해 차열페인트를 적용한 옥상의 표면과 반사광이 모이는 1.5 m 상부의 온도를 측정하였다. 하단부 장비는 주로 햇볕에 직접적인 영향권을 받아 복사열이 매우 뜨거운 표면부의 온도를 측정하게 되고, 상단부 장비는 직사광선을 그대로 받는 온도센서부의 외장 케이스의 표면온도를 측정하도록 설계하였다.
3.3 모니터링 수행 및 결과 분석
(1) 전체기간 모니터링 분석 결과
모니터링 기간인 8월 26일부터 10월 11일까지 기간의 데이터로거를 통해서 측정한 적용 비적용 대상지의 옥상 온도 추이를 살펴보면(Fig. 8, Table 7), 최고 온도는 42.5℃, 최저온도 15.0℃이며, 평균온도는 쿨월 루프 복합 적용가구 기준으로 옥상표면이 24.1℃, 대기 온도는 24.3℃이다. 온도 변화는 매일 일정한 패턴으로 변화하기 때문에, 옥상 표면의 온도가 가장 높았던 시점을 기준으로 측정 기간 최고 온도가 가장 높은 주간과 일간을 기준으로 심층적인 분석을 진행하였다.

Overall temperature trend on the roof (applied and non-applied site)
August 26th ~ October 11th rooftop temperature trends (applied and non-applied site) (unit ℃)
Fig. 9에서 모니터링 기간 동안 데이터로거를 통해서 획득한 적용 비적용 대상지 옥상의 최고온도 추이를 살펴 보면, 비적용 표면 기준 최고 온도 42.5℃, 최저온도 22.9℃이며, 평균온도는 쿨월 루프 복합 적용가구 기준으로 옥상표면이 31.8℃, 대기 온도는 34.4℃이다. 이에 전체 측정일자에서, 온도가 제일 높은 주간 (8월26일 ~ 31일)과 일자 8월 28일 옥상표면의 최고온도를 기준으로 심층적인 분석을 진행하였다.

Maximum temperature trend for rooftop surface during monitoring periods (applied and non-applied site)
(2) 주간 모니터링 분석 결과
주간 온도 모니터링 설정 기간인 8월 26일 ~ 31일 차열페인트 적용 및 비적용 옥상표면의 온도 측정값은 Fig. 10과 같으며 옥상대기 온도의 온도 측정값은 Fig. 11과 같다.

Aug. 26 ~ 31 rooftop surface temperature trends (applied and non-applied site)

Aug. 26th ~ 31st rooftop air temperature change (applied and non-applied site)
주간 모니터링 기간인 8월 26일부터 8월 31일까지 기간의 적용 비적용 대상지 옥상 최고 온도에 대한 분석결과는 Table 8과 같다. 적용 비적용 지역의 표면 온도 차는 최고온도 기준 –3.1℃, 평균온도 기준 –0.6℃으로 적용가구의 온도가 저감효과가 있는 것으로 확인되었다.
Aug. 26th ~ 31st measure temperature difference (applied and non-applied site) (unit ℃)
(3) 일자별 모니터링 분석 결과
1) 8월 28일 분석 결과(실외 기온)
측정기간 내 최고 온도일에 해당하는 8월 28일의 실외 기온에 대한 분석 결과는 Table 9과 같다. 측정된 옥상 표면 최고온도는 비적용지 42.5℃, 복합 적용지 39.4℃, 쿨월 적용지 41.2℃로 비적용지와 복합적용지의 온도차는 –3.1℃이고, 비적용지와 쿨월적용지와 온도차는 –1.3℃로 나타났다.
Aug. 28th Cool paint application and non-application, temperature change comparison and temperature difference
활동시간대인 오전 10시 ~ 오후 4시 적용 및 비적용 대상지 실내온도에 대한 분석결과는 Table 10과 같다. 실내 대상지의, 복합 적용과 비적용의 실내 천정 온도차는 최고 –5.2℃이며, 쿨월적용 비적용의 차이는 –1.4℃로 효과가 나타났다.
Aug. 28th, 10:00am to 4:00pm indoor highest, lowest, average temperature difference (applied and non-applied site) (unit ℃)
2) 9월 8일 분석 결과
측정기간 내 최고 온도일에 해당하는 9월 8일 오전 10시 ~ 오후 4시 실내온도에 대한 분석결과는 Table 11과 같다. 9월 8일 오전 10시 ~ 오후 4시 실내온도의 복합 적용와 비적용 대상지의 천정 온도차는 최고 –5.2℃이며, 쿨월 적용 대상지와 비적용 대상지의 차이는 –1.4℃이다.
Sep 8th 10:00am to 4:00pm indoor highest, lowest, average temperature difference (applied and non-applied site) (unit ℃)
3) 9월 11일 분석 결과
측정기간 내 최고 온도일에 해당하는 9월 11일 오전 10시 ~ 오후 4시 실내온도에 대한 분석결과는 Table 12과 같다. 9월 11일 오전 10시 ~ 오후 4시 실내온도의 복합 적용 대상지와 비적용 대상지의 천정 온도차는 최고 –3.6℃이며, 쿨월 적용 대상지와 비적용 대상지의 차이는 –1.7℃이다.
Sep 11th 10:00am to 4:00pm indoor highest, lowest, average temperature difference (applied and non-applied site) (unit ℃)
4) 10월 3일 분석 결과
측정기간 내 최고 온도일에 해당하는 10월 3일 오전 10시 ~ 오후 4시 실내온도에 대한 분석결과는 Table 13과 같다. 10월 3일 오전 10시 ~ 오후 4시 실내온도의 복합 적용 대상지와 비적용 대상지의 천정 온도차 최고 –3.6℃이며, 쿨월 적용 대상지와 비적용 대상지의 차이는 –2.5℃이다.
Oct 3rd 10:00am to 4:00pm indoor highest, lowest, average temperature difference (applied and non-applied site) (unit ℃)
3.4 설문 결과
Fig. 12에서 나타난 것과 같이 차열페인트 시공 후 나타난 실내온도 체감의 변화에 대하여 ‘매우 그렇다’ 비율은 53.3%, ‘그렇다’ 비율은 36.7%로 만족에 대한 비율이 훨씬 높게 나타났다. 또한 100점 만점으로 환산한 만족도 점수에서도 전반적인 점수는 100점 만점 기준 85.3점으로 전반적으로 높은 만족도 평가를 나타내었다.

Changes in the perceived indoor temperature after cool paint being applied
또한 만족에 대한 항목에 있어서는 실내환경 열쾌적성 증진 84점 > 냉방기기에 대한 사용량 감소는 83.2점 > 차열페인트 시공 후 체감 효과는 81.3점 > 폭염으로 인한 불편 완화는 76.7점 순으로 효과가 가장 큰 것으로 조사되었다.
Table 14에서 나타난 것과 같이 차열페인트 시공품질 및 관리에 대한 만족도 조사에서는 페인트 색상이 73.5점, 페인트 공사 일정 및 과정 81.3점, 페인트(냄새, 디자인, 성능 등)의 품질과 관련된 사항 84.7점의 순으로 나타났다. 종합적으로 차열페인트와 관련된 품질에 대한 만족도가 가장 높게 나타났다.
Satisfaction score for thermal insulation painting process and quality Color of paint – satisfaction scoreUnit: person (%, point)
차열페인트 지원과 관련된 항목에 대해서는 그렇다(45.2%) > 매우 그렇다(22.6%) > 그렇지 않다(16.1%) > 보통이다(12.9%) > 매우 그렇지 않다(3.2%)으로 응답률이 나타났으며 만족도는 100점 기준 평균점수는 73.5점으로 나타났다.
3.5 분석의 종합
본 연구는 2021년도 기후변화 취약계층 지원 사업으로 김해시 진영읍 61개 주택에 차열페인트(쿨루프, 쿨페인트)를 복합적용한 지역, 쿨월만 적용한 지역, 적용하지 않은 지역을 비교하여 실시간 온도 변화를 모니터링 하였다.
전체 측정일자에서 최고 온도일에 해당하는 8월 28일, 9월 8일, 9월 11일, 10월 3일 4개의 일자의 온도변화를 측정한 결과, Table 15에서 나타난 것과 같이 복합적용지와 비적용지의 옥상표면 평균 온도차는 –3.0 ~ –4.0℃이고, 옥상대기 평균 온도차는 –1.7℃, 쿨월적용지와 비적용지의 천정부의 평균 온도차는 –1.1℃, 실내 평균 온도차는 –2.3℃로 각각 적용가구에서 온도저감 효과가 더 높은 것으로 나타났다.
Aug. 28th, Sep. 8th, Sep. 11th, Oct. 3rd Comparison of applied and non applied site temperature(unit ℃)
T-test result of the Aug. 28th ~ Oct.11th Max. Avg. Min. temp data (combined vs. non applied)
이 외에 8월에서 10월까지의 추가적인 온도변화 모니터링으로 쿨월을 적용한 가구의 효과가 입증되었으며, 복합 적용가구가 쿨월 적용가구보다 온도저감 효과가 큰 것을 확인하였다. 위에서 제시한 체감온도와 불쾌지수 수식을 적용하였을 때, 쿨루프 쿨월 복합적용지와 비적용지의 평균 체감온도차는 -2.0℃이고, 평균 불쾌지수차는 –2.5℃로 나타나 실질적인 체감 효과가 있음을 확인하였다.
또한 Table 15 및 Fig. 13에서 나타난 것과 같이 8월 28일, 9월 8일, 9월 11일, 10월 3일로 갈수록 대기온도가 저감됨에 따라서. 차열 적용지와 비적용지의 온도 차이가 적어지는 것을 확인할 수 있었다.

Aug. 28th, Sep. 8th, Sep. 11th, Oct. 3rd Comparison of combined application, cool wall application and non-application, temperature differences
마지막으로 가장 효과의 차이가 큰 복합 적용지와 비적용지를 대상으로 T-test 분석을 통하여 온도차의 유효성을 확인하였다. 분석의 결과 평균 온도에서는 유의성이 발견되지 않았으나, 거주민들에게 가장 직접적으로 영향을 미치는 최고온도와 최저온도는 유의한 온도 차이가 있는 것으로 나타났다. 한편 본 연구에서는 쿨월 적용 지역과 비적용 지역을 비교하는 T-test에서는 유의성이 나타나지 않았는데, 기존의 다른 연구들과 비교해서 살펴보았을 때 이는 단일 적용지역의 온도저감 효과가 없었다고 해석하기 보다는 거주민들이 생활하는 공간의 제한된 조건에서 데이터를 수집하는 과정에서 오류가 발생했을 것으로 추정된다.
4. 결 론
본 연구는 기존의 온·습도를 측정한 다른 연구들과 다르게 멀티채널의 실시간 입력방식의 IoT 센서를 활용하여 보다 장시간에 걸쳐 매 20초마다 정밀한 온·습도 데이터를 수집하여 차열페인트 사업 전·후의 온도를 비교하였다. 본 연구에서는 주민들이 거주하고 있는 주택이라는 제한적인 환경에서 모니터링이 진행되었다는 점에서 면밀한 분석결과를 얻지는 못하였으나, 기후변화에 따른 폭염이나 이상 기후 등에 노출되고 있는 기후변화 취약계층에 대한 지원사업이 확대되고 있는 시점에서 본 연구에서 시도된 IoT 센싱을 활용한 모니터링 관련기술과 방법은 향후 확장성이 크고 수요가 많을 것으로 판단된다.
또한 본 연구에서는 여름철 차열페인트의 효과를 일부 증명하였으나, 추가적인 연구를 통해 겨울철 차열페인트의 효과를 증명하는 것이 필요하다. 차열페인트의 특성상 태양열을 반사시켜 여름철 폭염에 대비하는 것에는 큰 효과가 있으나, 겨울철에도 태양열을 반사 시켜 혹한기에 기후변화 취약계층의 난방을 어렵게 만드는 부작용을 가져올 수 있다는 우려가 제기되고 있다. 모니터링을 통해 살펴보았을 때 대기온도가 저감됨에 따라서 실내온도에 미치는 영향이 적어지는 것은 확인하였으나 더욱 구체적인 연구를 통해서 차열페인트의 계절별 효과를 증명하는 과정이 필요하다. 나아가 이와 같은 연구들을 바탕으로 정책적 차원에서 효과적인 사업이 진행되기 위해서는 차열페인트 지원 사업을 어떻게 체계화 시켜야하는지 또한 모니터링 방법론을 구축하고 모델화할 수 있는지에 대한 연구가 추가적으로 진행되어야 할 것으로 생각된다.
Acknowledgments
본 논문은 2021년 한국환경연구원에서 환경부의 수탁과제로 수행된 『취약계층·지역의 기후탄력성 강화 및 적응관련 전문인력 양성 방안 마련 – (세부) 취약계층 지원사업 표준모델 및 폭염대응시설 가이드 개발 (2021-001-05)』의 연구 결과를 기초로 작성되었습니다.
Notes
References
-
Anting, N., Din, M. F. M., Iwao, K., Ponraj, M., Siang, A. J. L. M., Yong, L. Y., Prasetijo, J. 2018. Optimizing of near infrared region reflectance of mix-waste tile aggregate as coating material for cool pavement with surface temperature measurement. Energy and Buildings, 158: 172-180.
[https://doi.org/10.1016/j.enbuild.2017.10.001]

-
Hendel, M., Parison, S., Grados, A., Royon, L. 2018. Which pavement structures are best suited to limiting the UHI effect? A laboratory-scale study of Parisian pavement structures. Building and Environment, 144: 216-229.
[https://doi.org/10.1016/j.buildenv.2018.08.027]
- Hur JH. 2013. Reduction of the urban temperature using the pavement material lowering the heat island effect [dissertation]. Seoul National University of Science and Technology. (in Korean with English abstract)
- Kim GH. 2021. Monitoring regional inequalities in climate change risk - A focus on heatwave-. Korean Env. Res.Tech 24(6): 97-107. (in Korean with English abstract)
-
Kolokotroni M, Shittu E, Santos T, Ramowski L, Mollard A, Rowe K, Wilson E, de Brito Filho JP, Novieto D. 2018. Cool roofs: High tech low cost solution for energy efficiency and thermal comfort in low rise low income houses in high solar radiation countries. Energy and Buildings, 176: 58-70.
[https://doi.org/10.1016/j.enbuild.2018.07.005]
-
Kolokotsa, D.D., Giannariakis, G., Gobakis, K., Giannarakis, G., Synnefa, A. Santamouris, M., 2018. Cool roofs and cool pavements application in Acharnes, Greece. Sustainable Cities and Society, 37: 466-474.
[https://doi.org/10.1016/j.scs.2017.11.035]
-
Lee GS, Kim GG, Cho SH. 2021. Temperature analysis by roof material using UAV-based thermal infrared image. Journal of The Korean Cadastre Information Association. 23(1): 57-72. (in Korean with English abstract)
[https://doi.org/10.46416/JKCIA.2021.04.23.1.57]
-
Lee S., Kwon, B. Y., Jung, D., Jo, K., Kim, M., Ha, S., ... & Kim, Y. 2013. Future Prediction of Heat and Discomfort Indices based on Two RCP Scenarios. Atmosphere, 23(2): 221-229.
[https://doi.org/10.14191/Atmos.2013.23.2.221]
- Lim YS., Zoh Daniel HM, Kwon TK, 2021. KACCC, Development of a standard model for support projects for vulnerable groups in climate change and guides for heat wave response facilities.
- ME(Ministry of Environment). 2020. Monitoring and Result Analysis of Regional Vulnerability Improvement Project for Climate Change Adaptation in 2020 - “Cool Our Neighborhood” Project in Andong, Gyeongbuk.
- ME(Ministry of Environment). 2021. Heat wave response facility installation and management (cool roof) guide for adaptation to climate change.
- Park CY, Lee DK, Kwon EG, Her MJ. 2017. Green-infra strategies for Mitigating Urban Heat Island. Korean Env. Res. Tech. 20(5): 67-81. (in Korean with English abstract)
- Park JG, Kim BS, Lee JT, Yoon SH, Jung WS, Kim EB, Park GW, Jung GS. 2005. Distribution of Wind Chill Temperature by Region by Cluster Analysis. Proceedings of the Korean Environmental Sciences Society Conference. (in Korean)
- Park MY. 2020. Comparison of Thermal Characteristics on Cool Roof of Vacuum Ceramic Coatings and Rooftop Waterproofing Coatings. Journal of KIAEBS 14(1): 32-41. (in Korean with English abstract)
-
Pisello, A. L., Cotana, F. 2014. The thermal effect of an innovative cool roof on residential buildings in Italy: Results from two years of continuous monitoring. Energy and Buildings, 69: 154-164.
[https://doi.org/10.1016/j.enbuild.2013.10.031]
-
Song BG, Kim GA, Park KH. 2016. Reduction in Indoor and Outdoor Temperature of Office Building with Cool Roof. Korea Institute of Ecological Architecture and Environment 16(6): 95-101. (in Korean with English abstract)
[https://doi.org/10.12813/kieae.2016.16.6.095]
-
Stavrakakis, G. M., Androutsopoulos, A. V., Vyörykkä, J. 2016. Experimental and numerical assessment of cool-roof impact on thermal and energy performance of a school building in Greece. Energy and Buildings, 130: 64-84.
[https://doi.org/10.1016/j.enbuild.2016.08.047]
-
Xie, N., Li, H., Abdelhady, A., Harvey, J. 2019. Laboratorial investigation on optical and thermal properties of cool pavement nano-coatings for urban heat island mitigation. Building and Environment, 147: 231-240.
[https://doi.org/10.1016/j.buildenv.2018.10.017]
- Yoon YS, Lee SK, Ahn HH. 2016. A long-term counterproposal of Heat wave damage measures for climate change. Journal of disater prevention 18(5): 13-35. (in Korean with English abstract)