SSP 시나리오에 따른 동아시아 극한기후 미래전망
 ; Kim, Jisun**
 ; Sung, Hyun Min* ; Lee, Jae-Hee**
 ; Kwon, Sang-Hoon**
 ; Sun, Min-Ah**
 ; Ha, Jong-Chul***
 ; Byun, Young-Hwa***, †
 ; Kim, Yeon-Hee****
Abstract
This study investigates the extreme temperature and precipitation indices as defined by the Expert Team on Climate Change Detection and Indices (ETCCDI). We calculate 14 indices representing extreme climate over East Asia. Here, we utilized the ensemble results of NIMS-KMA (National Institute of Meteorological Sciences and Korea Meteorological Administration) climate models (UKESM1 and K-ACE) for analysis of long-term variation in present-day (1995 ~ 2014) and future (2015 ~ 2100) periods. The spatial distributions of simulated daily maximum and minimum temperatures and daily mean precipitation are comparable to those of ERA5 reanalysis data. Simulated extreme indices are well reproduced in the present-day period, although the NIMS-KMA climate models tend to underestimate annual minimum temperature extremes and overestimate extremes in precipitation intensity. In the future scenarios (SSP1-2.6, SSP2-4.5, SSP3-7.0, and SSP5-8.5), intensity and frequency of warm temperature extremes increased for the late 21st century, but magnitude and number of cold temperature extremes significantly decreased. Changes in extreme precipitation associated with a warming climate are becoming more intense and frequent in Southern China. But the changes in precipitation duration indices tend to have high uncertainty under SSP scenarios.
Keywords:
SSP Scenarios, Extreme Climate, ETCCDI, CMIP6, NIMS-KMA1. 서론
기후변화에 관한 정부 간 협의체(Intergovernmental Panel on Climate Change, IPCC)의 평가보고서에 따르면, 극한기온 현상과 해수면 상승 및 집중호우의 증가 등 21세기의 극한기후 현상은 현재보다 더 강하고 빈번하게 나타날 것으로 전망된다(IPCC, 2014). 또한, 평가보고서는 화석연료에 의존한 에너지 소비로 온실가스의 배출이 증가함에 따라 전지구 온난화는 가속화되고 있으며, 이로 인해 기후시스템을 이루는 모든 구성 요소들이 장기적으로 변화되어 돌이킬 수 없는 영향을 미칠 수 있다고 경고하고 있다. 유엔기후변화회의(UN Framework Convention on Climate Change, UNFCCC)에서 체결된 파리협약은 이러한 기후위기 상황을 방지하기 위해, 전지구 기온상승을 산업혁명 이전보다 1.5℃(2℃ 이하)로 제한시키기 위해 온실가스 배출량을 줄이는 것을 목표로 하고 있다. 또한, 2018년 발간된 ‘지구온난화 1.5℃ 특별보고서’에 따르면 전지구 평균 기온이 목표치인 1.5℃에서 0.5℃가 더 오른다면 극한기후 현상에 노출될 가능성이 훨씬 클 뿐만 아니라 지역적인 기후 취약성도 증가할 것으로 내다보고 있다(IPCC, 2018; Shim et al., 2019).
우리나라 또한 기후변화로 인해 수자원, 생태계, 산림, 농업, 산업, 에너지 등 다양한 영역에 걸쳐 상당한 경제적 피해가 우려된다(KEI, 2011). Kim et al.(2015)에 따르면, 우리나라의 미래 폭염 및 열대야로 인한 온열질환 피해가 증가할 것으로 예상된다. 또한, 열팽창과 빙하녹음 증가에 따른 해수면 고도의 상승은 연안지역의 피해를 증가시킬 것으로 전망되었다(Hoe et al., 2018; Sung et al., 2021). 그뿐만 아니라 여름철 극한 고온 현상의 증가로 인해 냉방을 위한 에너지 소비가 증가해 전력 관리의 중요성도 대두되고 있다(Lee et al., 2014). 이처럼 기후변화로 인한 다양한 사회이슈에 적절하게 대응하고, 극한기후 현상을 정량적으로 분석하기 위한 ETCCDI (Expert Team on Climate Detection and Indices) 지수의 활용 연구는 활발하게 진행되어 왔다(Kim et al., 2015; Hong and Ying, 2018; Cheong et al., 2018; Kim et al., 2020). 하지만 분석 자료와 지역에 따른 불확실성이 크기 때문에 국내 적용을 위한 연구는 여전히 부족한 실정이다. 또한, 환경부 기후변화 적응대책 이행을 지원하기 위해서는 일관된 과학정보 제공이 필수적이다. 본 연구에서는 정책수립의 근거자료로 활용하고 미래전망의 신뢰도 확보를 위해, 국가 기후변화 표준 시나리오를 활용해 동아시아 지역의 극한기후에 대한 분석을 수행하고자 하였다.
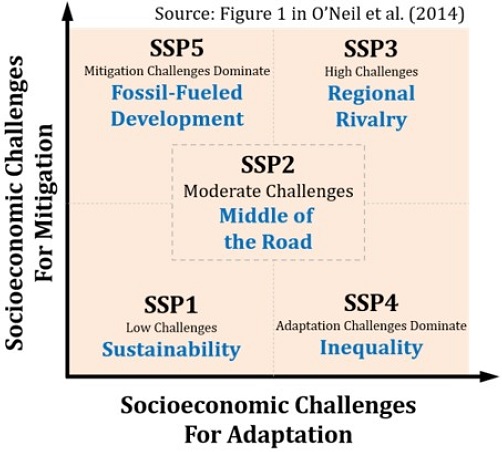
국립기상과학원은 IPCC 제6차 평가보고서(The 6th Assessment Report: AR6) 대응 및 국내 기후변화 정책 지원을 위해 공통사회경제 경로(Shared Socioeconomic Pathway, SSP)에 기존의 대표농도 경로(Representative Concentration Pathway, RCP)를 반영한 새로운 국가 기후변화 표준 시나리오를 산출하고 국내외 연구자들에게 제공하고 있다(Lee et al., 2019; Sung et al., 2020; Sellar et al., 2020; Shim et al., 2020). SSP 시나리오는 IPCC AR6에 새롭게 도입된 개념으로써 사회경제변화를 기준으로 기후변화에 대한 완화와 노력에 따라 5개의 그룹으로 이뤄져 있다(O’Neill et al., 2014; 2017). SSP1은 적응과 감축의 부담이 낮은 미래로써 친환경 지속성장 경로이며, SSP2는 현재 추세들을 유지하는 중도성장 경로이다(Fig. 1). SSP3의 경우 지역 갈등이 심해지고 기후변화에 취약한 상태에 놓이는 경로이며, SSP4는 불평등으로 인해 기후변화 적응 과제의 달성이 어려운 경로이다. 마지막으로 SSP5의 경우 화석연료에 의존해 높은 기술 성장을 이루어 기후변화 적응은 어렵지 않으나 완화는 어려울 것으로 예상하는 경로이다. 본 연구에서는 기상청-국립기상과학원에서 운영하는 지구시스템모델(UKESM1, K-ACE)의 극한기후 모의 성능을 평가하였으며, SSP 시나리오를 기반으로 동아시아 극한기후 지수를 산출하고 미래 변화를 살펴보았다. 2장에서는 국립기상과학원에서 CMIP6에 참여해서 생산한 자료 및 분석 방법을 제시하였다. 3장에서는 분석 자료에 대한 모의 성능 평가 및 기후변화 시나리오에 따른 극한기후 변화에 대해 설명하였으며, 4장은 요약 및 결론 순으로 정리하였다.
2. 자료 및 방법
2.1 지구시스템모델 자료
본 연구에서는 기후변화 시나리오에 따른 동아시아 극한기후 변화를 살펴보기 위하여, 국립기상과학원에서 산출한 UKESM1 (UK’s Earth System Model version1) 및 K-ACE (KMA’s Advanced Climate Earth System Model) 지구시스템모델 자료를 사용하였다(이후 NIMS-KMA 지구시스템모델). UKESM1과 K-ACE는 같은 대기 모델을 사용하고 있으며 수평 해상도는 약 135 km(1.875° × 1.25°)이고, 연직 레벨은 총 85층으로 이뤄져 있다(Sellar et al., 2020; Lee et al., 2019). 사용한 실험과 분석 기간은 과거모의 실험(Historical) 20년(1995 ~ 2014년) 및 미래전망 시나리오 86년(2015 ~ 2100년) 이다. 미래전망 시나리오는 세계기후연구프로그램(World Climate Research Programme, WCRP)은 결합모델간 상호비교 프로젝트(Coupled Model Intercomparison Project Phase 6, CMIP6)의 개별 MIP 중 하나인 ScenarioMIP의 Tier1 실험 4종(SSP1-2.6, SSP2-4.5, SSP3-7.0, and SSP5-8.5) 결과를 사용하였다(Eyring et al., 2016; O’Neill et al., 2017). 분석에 사용된 변수는 일최고기온(TASMAX), 일최저기온(TASMIN) 및 강수량(PR)이며 모델의 내부 변동성에 대한 불확실성을 줄이기 위해, 각 모델은 초기조건을 다르게 처방한 3개의 앙상블 자료를 사용하였다. 선행연구에서 NIMS-KMA 모델에서 산출된 기온, 강수, 복사량 등 20개의 주요 기후요소에 대해 관측 및 재분석자료와 비교 평가하였으며, 동아시아 지역에서 다른 CMIP5 모델 대비 좋은 모의 수준을 보였다(Sung et al., 2020). 이를 바탕으로 NIMS-KMA 지구시스템모델 자료는 2020년 국가 기후변화 표준 시나리오 인증을 획득하였으며, 기상청 기후정보포털을 통해 평균 기온과 강수량 자료를 제공하고 있다. 또한, 본 자료는 대학 및 연구기관의 전문사용자를 위해 오프라인 제공 및 IPCC AR6 기여를 위해 국제자료공유센터(ESGF)를 통해 서비스되고 있다(Lee et al., 2020).
2.2 관측 및 재분석 자료
지구시스템모델 산출물은 격자자료(gridded data)로 출력되기 때문에 모의된 기온과 강수 등 모델의 성능 평가 및 편차를 계산하기 위해서는 지점 관측자료 보다는 격자 단위 기반의 자료를 활용하는 것이 합리적이다(Hwang et al., 2018). 재분석자료의 경우 일정한 시간 및 공간 격자 형태로 제공되고 있는 과거 기상 자료로써 기후변화 연구 및 기후 모델링 연구 등 다양한 분야에서 광범위하게 활용되고 있다(Kim et al., 2020; Sillmann et al., 2013; Ciccarelli et al., 2008; Wang et al., 2006). 따라서, NIMS-KMA 지구시스템모델에서 산출한 동아시아 기온과 강수 및 극한기후지수의 모의성능 평가를 위해 재분석자료 및 관측자료를 이용하였다. 먼저 기온과 강수에 대한 평가를 위해 유럽중기기상예보센터(European Centre for Medium-Range Weather Forecasts, ECMWF)에서 제공하는 고해상도 재분석 자료 ERA5 (ECMWF ReAnalysis version 5)를 사용하였다. ERA5 자료는 Copernicus Climate Change Service를 통해 제공되고 있으며(링크: https://cds.climate.copernicus.eu), 재분석 자료의 수평 해상도는 0.25° × 0.25°(격자수: 721 × 1440)으로 이뤄져 있다. 그리고 지구시스템모델로부터 계산한 ETCCDI 극한기후지수의 모의성능 평가를 위해 재분석자료 뿐만 아니라, 영국기상청 해들리센터(Met Office Hadley Centre)에서 생산하는 HadEX3 관측자료를 활용하였다. HadEX3 자료는 지상관측 자료를 기반으로 산출한 격자화 된 극한기후지수를 제공하고 있으며, 수평 해상도는 1.875° × 1.25°(격자수: 192 × 144)로 이뤄져 있다(Dunn et al., 2020). 분석기간은 IPCC AR6에서 권고하는 20년 평균 현재기후(1995-2014년) 기간자료를 사용했으며, 직접적인 비교의 편의를 위해 모든 자료는 NIMS-KMA 지구시스템모델 격자와 동일하게 1.875° × 1.25°(격자수: 192 × 145) 격자로 선형 내삽하였다.
2.3 분석 방법
극한기후는 과거에 발생하지 않았거나 아주 드물게 발생하던 기상 현상으로 일반적으로 일정한 주기와 패턴에 따라 발생하지 않기 때문에 월평균 또는 연평균 변화를 살펴보는 것으로는 한계가 있다. 따라서 세계기상기구(World Meerological Organiation, WMO)에서는 극한기후에 있어 일 단위 분석의 중요성을 인식하고 이와 관련된 가이드라인을 제시하고 있다(WMO, 2009). 관측 및 모델 자료를 통해 극한기후 변화를 탐지 및 감시할 수 있도록 표준화된 극한기후지수인 ETCCDI를 정의하고 있으며, 이는 온도 관련 지수 16개와 강수 관련 지수 11개로 총 27개의 지수로 구성하고 있다. 본 연구에서는 SSP 시나리오에 따른 극한기후의 빈도, 강도, 및 지속시간에 대한 변화를 살펴보기 위해, ETCCDI 극한기후지수 중 기온 관련 지수 8개와 강수 관련 지수 6개를 선정해 살펴보았다(Table 1).
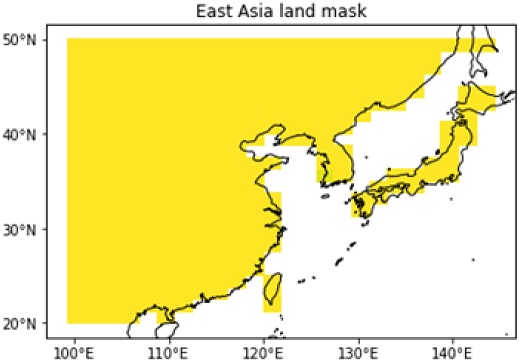
먼저 현재 기후(1995 ~ 2014년)에 대한 극한기후지수를 산출한 후, 현재 기후 대비 미래 21세기 후반(2081 ~ 2100년)에 대한 아노말리를 계산하였다. 또한, 모델이 가지는 불확실성을 고려해 6개의 개별 앙상블 실험으로부터 20년 극한지수 평균값을 구한 후 최종적으로 앙상블 평균값을 사용하였다. 분석 영역인 동아시아 도메인(20-50°N, 110-145°E)은 Takeshima et al. (2020) 연구를 참고하였으며, NIMS-KMA 지구시스템모델의 지면마스크를 이용해 육지에 대한 극한기후지수의 변화를 분석하였다(Fig. 2). 또한 현재 기후와 미래 극한기후지수 간의 차이가 유의한지를 살펴보기 위하여 Student’s t-test를 수행하였다. 20년 기간의 현재 기후와 SSP 미래 전망 극한지수 자료를 두 개의 표본으로 설정하였으며, 각 격자점별로 계산하여 통계적 유의성을 검정하였다.
3. 결과
3.1 지구시스템모델 모의 성능
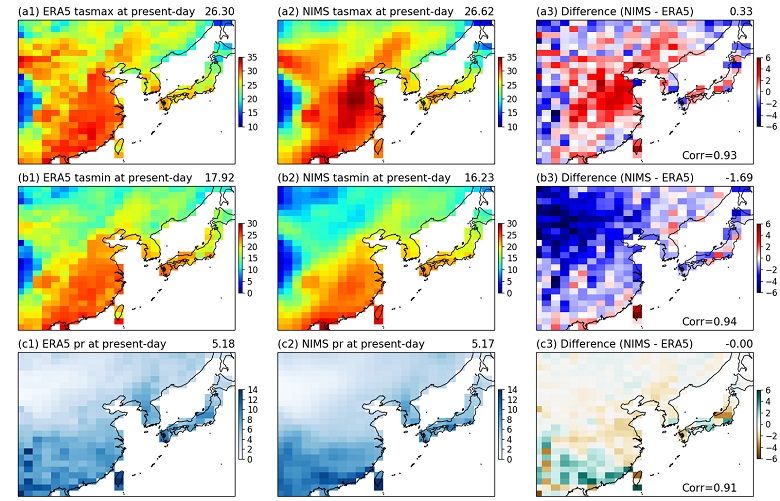
NIMS-KMA 지구시스템모델의 과거모의 실험을 통해 산출된 현재 기후(1995 ~ 2014년)에 대한 연평균 및 계절별 일최고기온과 일최저기온 및 일강수량을 ERA5 재분석자료와 비교하였다(Fig. 3-5). 연평균 일최고기온을 살펴보면 재분석자료와 지구시스템모델의 공간 분포의 패턴상관계수가 0.98로 상당히 유사하게 나타났다(Fig. 3a). 하지만 동아시아 지역에 대한 재분석자료의 일평균 최고기온은 14.7℃이며 지구시스템모델은 14.0℃으로, 모델에서 모의한 일최고기온은 재분석자료와 비교해서 약한 음의 편차(-0.8℃)를 보였다. 지역별로는 만주와 극동러시아 같은 고위도 지역과 중국 서부내륙에서의 차이가 컸다. 모델에서 모의된 연평균 일최저기온도 재분석자료와 비교해 높은 상관관계(0.98)를 보였다. 그러나 일최고기온에 비해 상대적으로 음의 편차(-1.9℃)가 컸으며, 이러한 차이는 고위도 내륙 지역에서 뚜렷하게 나타났다(Fig. 3b). 연평균 일강수량은 몬순시스템의 영향으로 중국 남동부터 일본 남부 해안지역의 위도대에 강수가 집중되는 특징이 나타나는 등 선행연구(Freychet et al., 2016; Kwon et al., 2017)와 유사한 경향을 보였다(Fig. 3c). 하지만 정량적으로는 모델이 재분석자료에 비해 다소 과대 모의하는 경향이 나타났다.
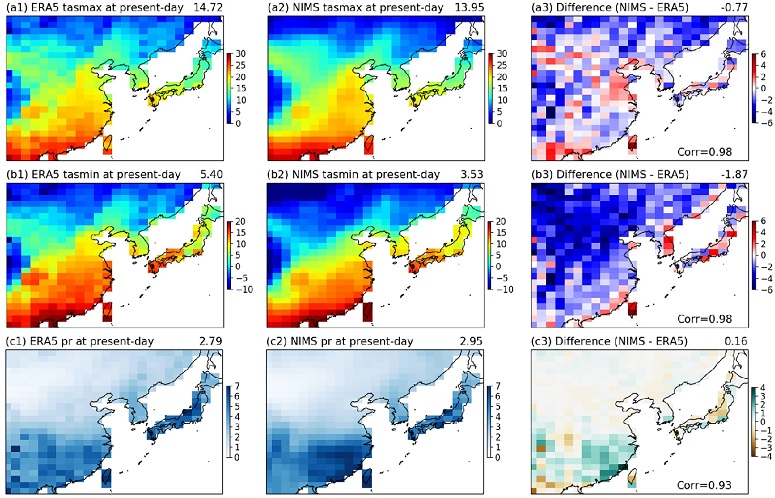
Spatial distribution of the annual mean daily maximum temperature (a1-a3, unit: ℃), daily minimum temperature (b1-b3, unit: ℃), and daily precipitation (c1-c3, unit: mm/day), respectively averaged in 20 years (1995-2014) from ERA5 reanalysis data (a1-c1), NIMS-KMA ensemble mean (a2-c2), and their differences (a3-c3). The domain average value is shown in the right corner. And spatial correlation (Pearson R) between the ERA5 reanalysis and the NIMS-KMA simulated variables are shown in the bottom right corner (a3-c3).
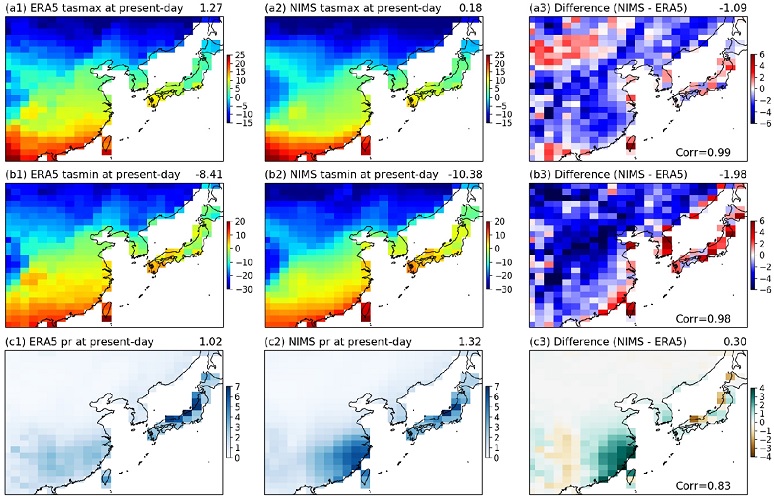
계절 변화에 대해 살펴보면, 재분석자료의 여름철에는 중국 동부와 남부지역에서 높은 일 최고기온이 나타났으나, 지구시스템모델에서 모의된 일 최고기온은 중국 동부지역에서 과대모의 경향이 나타났다(Fig. 4a). 일 최저기온은 앞서 연평균 분포와 유사하게 중국 남부지역과 저위도 해안 주변에서 높은 온도가 나타났으며, 몽골지역과 해안 일부를 제외하면 전반적으로 지구시스템모델이 재분석자료에 비해 과소모의 경향을 보였다(Fig. 4b). 여름철에 강수가 집중되는 몬순시스템의 영향으로 중국, 우리나라, 일본의 남부지역에 높은 강수량이 나타났으며, 강수의 최대 지역에서 다소 과대모의 경향을 보였다(Fig. 4c). 겨울철에는 시베리아 고기압의 차가운 기단의 영향으로 일 최고기온과 일 최고기온 모두 고위도 지역에서 상당히 낮았으며(Fig. 5a,b), 특히 여름철에 비교하면 재분석자료와 모델에서 산출된 기온 분포의 패턴상관계수가 0.98 이상으로 매우 높게 나타났다. 반면, 겨울철 강수량은 중국 남부와 일본 북쪽에 집중되는 특징을 보였으며(Fig. 5c), 중국 동남부 지역의 강수를 다소 과대모의 하는 경향이 나타나 여름철에 비해 낮은 상관관계(0.83)를 보였다.
전반적으로 모델에서 산출된 현재 기후의 기온 및 강수의 모의성능이 재분석자료와 비교 했을 때, 일부 지역에서 편차는 있으나 동아시아 지역 평균과 공간분포 경향은 유사하게 나타났다. 극한기후에 대한 미래 변화를 살펴보기에 앞서 HadEX3 관측자료 및 ERA5 재분석자료를 이용해 현재 기후에 대한 동아시아 기온과 강수의 극한기후지수를 계산하고 지구시스템모델 앙상블 간 편차를 비교하였다(Fig. 6). 퍼센타일로 판별하는 극한기후 지수들(TX10p, TN10p, TX90p, TN90p)은 자료간 큰 차이가 없어 그림에 제외하였다.
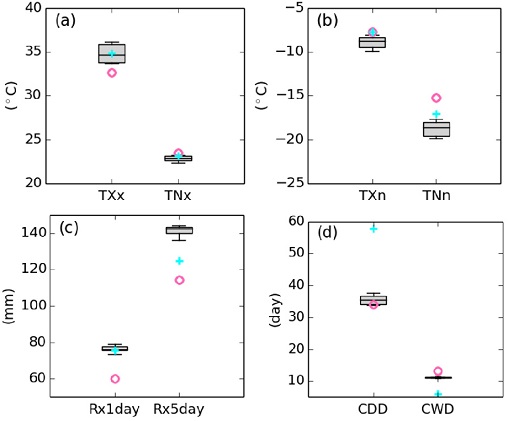
Box-and-whisker plots for present-day (1995-2014) extreme indices: (a) TXx, TNx, (b) TXn, TNn, (c) Rx1day, Rx5day, (d) CDD, CWD from NIMS-KMA models with ERA5 reanalysis (pink circles) and HadEX3 observation (blue plus signs)
현재 기후에 대한 일 최고기온의 연 최대값(TXx)과 일최저기온의 연 최대값(TNx)는 각각 34.8 ± 1.2℃와 22.9 ± 0.4℃으로 나타났으며(Fig. 6a), 일최고기온의 연 최소값(TXn)과 일 최저기온의 연 최소값(TNn)은 –8.9±0.7℃와 –18.7±1.0℃으로 모의되었다(Fig. 6b). 모델로부터 계산된 일 최고기온의 극한지수(TXx, TXn)의 사분위수범위(IQR, Interquartile range)에 HadEX3 관측자료가 위치하였으나, ERA5 재분석자료와 비교하면 최고값(최저값)은 더 크게(작게) 나타났다. 최저값(TNn)에 대한 모델의 모의 수준은 ERA5 재분석자료 및 HadEX3 관측자료와 비교해서 다소 과소모의 경향을 보였다.
현재 기후에 대한 모델의 1일 최대 강수량(Rx1day)과 5일 최대 강수량(Rx5day)은 각각 76.4 ± 1.9 mm, 141.3 ± 3.0 mm로 분석되었다(Fig. 6c). Rx1day의 경우 관측과 유사한 범위가 나타났으나 재분석자료는 이와 비교해 약한 강수량을 보였다. Rx5day의 경우 모델에서 모의한 강수 극한이 관측과 재분석자료보다 약 30% 정도 크게 모의하고 있었다. 하지만 강수의 지속시간과 관련된 지수인 무강수지속일수(CDD)와 강수지속일수(CWD)는 각각 35.6 ± 1.7일과 11.1 ± 0.2일로 관측자료와 비교해서는 각각 과소/과대 모의 경향이 나타났으나, 반대로 재분석자료와는 유사한 수준으로 나타났다(Fig. 6d). CMIP 모델에서 모의한 CDD 극한지수가 관측보다 전반적으로 과소 모의하는 문제는 모델이 약한 강수를 빈번하게 발생시키는 경향 때문으로 잘 알려져 있다(Stephens et al., 2010; Srivastava et al., 2020; Chen et al., 2021).
3.2 극한기온지수 미래전망
지구시스템모델의 과거모의 실험을 통해 산출된 현재 기후의 극한기후지수들을 기준으로 SSP 4종 기후변화 시나리오에 따른 동아시아 극한기후지수의 미래 변화를 계산하였다(Fig. 7). 동아시아 지역의 극한기온의 강도(TXx, TXn, TNx, TNn)의 변화는 현재 기후 대비 21세기 후반 뚜렷한 증가 경향이 나타났다(Fig. 7a-d, Fig. 8a). 전반적으로 저탄소 배출정책이 고려한 SSP1-2.6 시나리오 비해 온실가스 배출량이 높은 SSP3-7.0과 SSP5-8.5에서 극한기온지수의 증가가 컸다. 특히 가까운 미래인 2040년까지는 시나리오별 차이가 크지 않았으나, 21세기 중반 이후로 시나리오에 따라 큰 차이가 발생하였다(Fig. 7a-d). 이러한 결과는 선행연구에서도 유사한 경향을 확인할 수 있었다(Shin et al., 2021). 또한, 극한기온의 강도는 SSP1-2.6과 SSP2-4.5 시나리오의 경우 21세기 중반 이후 증가 경향이 완만해지는 반면, SSP3-7.0과 SSP5-8.5 시나리오에서는 지속적인 증가가 나타났다. 이러한 분석결과는 온난화가 가속화될수록 극한기온의 변화도 큰 폭으로 증가할 수 있음을 의미한다. 한반도 지역의 경우 극한기후지수 미래전망은 전반적으로 동아시아 지역과 유사한 변화 경향이 나타났으나, 한반도 지역의 격자수가 충분하지 않아 분석에 제한적이기 때문에 결과 해석에 주의가 요구된다(Fig. A1,A2).
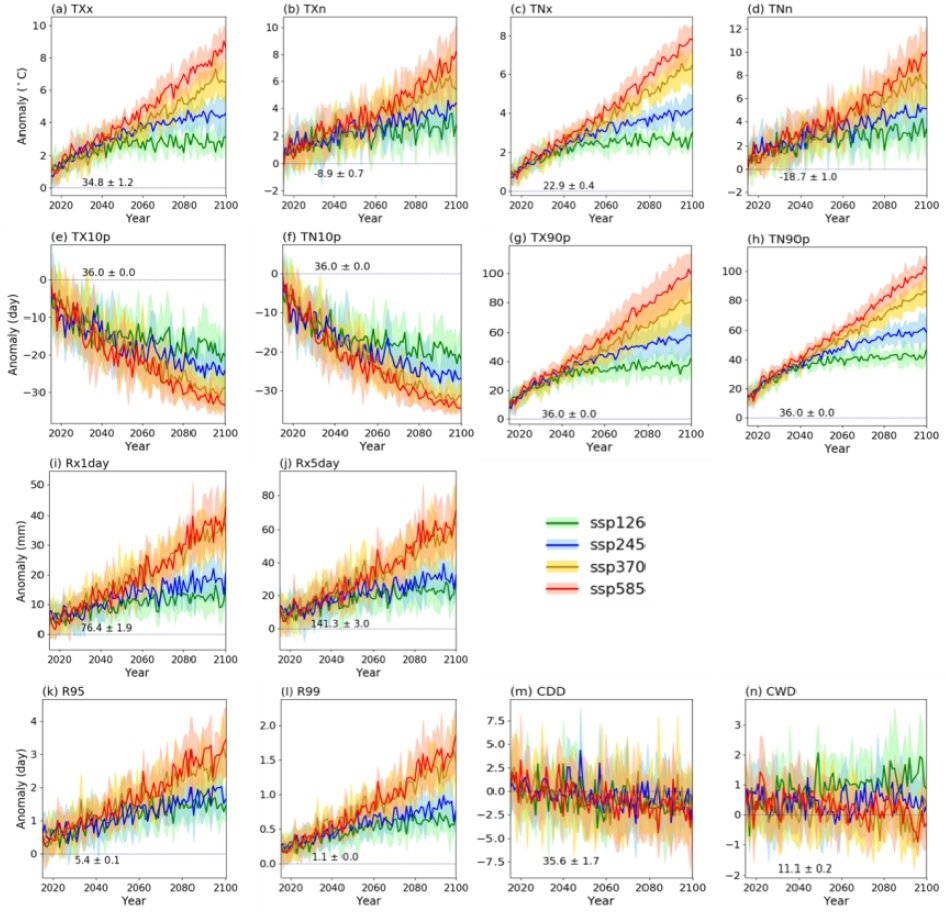
Change in anomaly series of extreme climate indices averaged over East Asia during 2015 ~ 2100 from the SSP scenarios. The dotted reference lines and values denote the ensemble mean value (±1 standard deviation) for the years 1995 ~ 2014 in each plots.
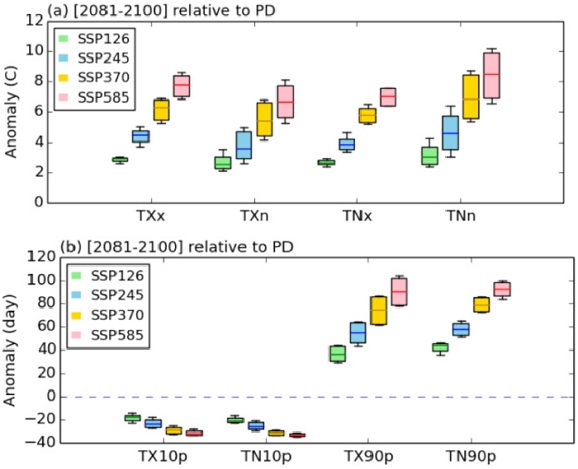
Changes in extreme temperature intensity and frequency indices: (a) TXx, TNx, TXn, TNn, (b) TX10p, TN10p, TX90p, TN90p for the late 21st centuray (2081 ~ 2100) relative to the present-day mean (1995-2014). Each color denotes a different SSP scenario and the boxes and whiskers indicate the interquartile model spread range between the 25th and 75th percentiles) and the total ensemble range, respectively.
21세기 후반 극한기온의 강도(TXx, TXn, TNx, TNn)는 현재 대비 2.9 ~ 7.9℃ / 2.7 ~ 7.1℃ / 2.7 ~ 6.7℃ / 3.2 ~ 8.6℃으로 증가가 전망되었고, 연최고기온(TXx)와 연최저기온(TNn)이 SSP 시나리오에 따라 가장 큰 변화 폭을 보였다. 두 극한기온 지수는 여름철 폭염과 겨울철 한파 발생과 밀접하게 관련되어 있기 때문에(KMA, 2012), 21세기 후반의 극한 고온 현상은 강화되고 반대로 극한 저온 현상은 약해질 것으로 전망되었다. 최저기온의 증가가 최고기온의 변화보다 클 것으로 전망되며 이는 ‘한반도 100년의 기후변화 보고서’ 및 선행연구와 일치하는 결과이다(Kim et al., 2018; Zhou et al., 2014). 공간분포의 변화를 살펴보면 중국 화북지역 일부를 제외하고 동아시아 전역에서 통계적으로 유의미한 증가 경향이 나타났다(Fig. 9). 특히, 위도 40°N 이상의 고위도 지역에서는 극한기온이 현재기후 대비 10℃ 이상 높아질 것으로 전망되었다. 반면 일최저기온과 관련된 TNx와 TNn의 경우 고위도 지역 외에도 중국 내륙인 화동 지역에서 큰 증가 경향을 보였다(Fig. 9b,d).
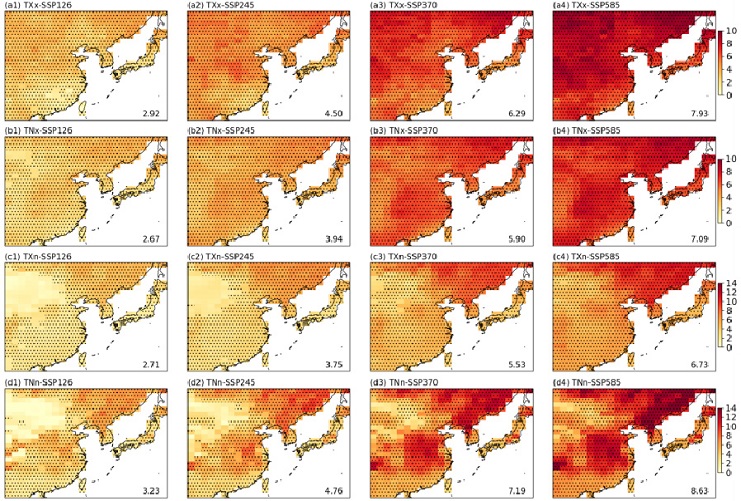
Spatial distributions of the annual mean extreme temperature intensity indices: (a1-a4) TXx, (b1-b4) TNx, (c1-c4) TXn, (d1-d4) TNn during 2080-2100 over East Asia from (a1-d1) SSP1-2.6, (a2-d2) SSP2-4.5, (a3-d3) SSP3-7.0, (a4-d4) SSP5-8.5 scenario relative to the present-day mean (1995 ~ 2014). Black dotted grids represent the changes are statistically significant at 1% level. The domain average value is shown in the low right corner.
극한기온 발생 빈도를 나타내는 극한지수(TX10p, TN10p, TX90p, TN90p)의 미래 변화 경향을 살펴보면(Fig. 7e-h, Fig. 8b), 일 최고기온과 일 최저기온이 10퍼센타일 이하 한랭일(TX10p)과 한랭야(TN10p)의 발생 빈도는 모든 시나리오에서 감소하고 있다. 온난화가 진행되면서 현재 대비 TX10p와 TN10p는 약 18-31일, 20-33일 줄어드는 것으로 나타났다. 특히 온난화 수준이 높은 SSP5-8.5 시나리오에서는 현재 대비 약 90% 이상 감소하였으며 SSP1-2.6 저탄소 시나리오에서도 50% 이상 줄어들고 있어, 먼 미래에는 현재 수준의 한랭일과 한랭야 발생은 크게 줄어들 것으로 예상한다. 반면 일최고기온과 일최저기온이 90퍼센타일 이상 온난일(TX90p)과 온난야(TN90p)는 모든 시나리오에서 뚜렷하게 증가하고 있다. SSP1-2.6 시나리오의 경우 온난일과 온난야 발생 빈도는 현재보다 두 배 이상 증가하고 있으며, 특히 SSP5-8.5에서의 극한기온 현상의 발생 빈도는 90일 이상 증가할 것으로 전망되었다.
극한기온 발생 빈도와 관련된 지수들의 지역별 미래 변화를 살펴보면, TX10p와 TN10p의 경우 일본, 중국 남서부, 우리나라 및 만주 지역에서 통계적으로 유의미한 감소가 전망되었다(Fig. 10a,b). 또한, 극한 저온의 빈도가 감소한 지역은 앞서 살펴본 TNn 지수의 증가와 높은 상관관계를 보였다(Fig. 7d). 반면, TX90p와 TN90p의 발생 빈도는 오히려 증가하였으며, 30oN 이남 저위도 지역에서의 뚜렷한 경향이 나타났다(Fig. 10c,d).
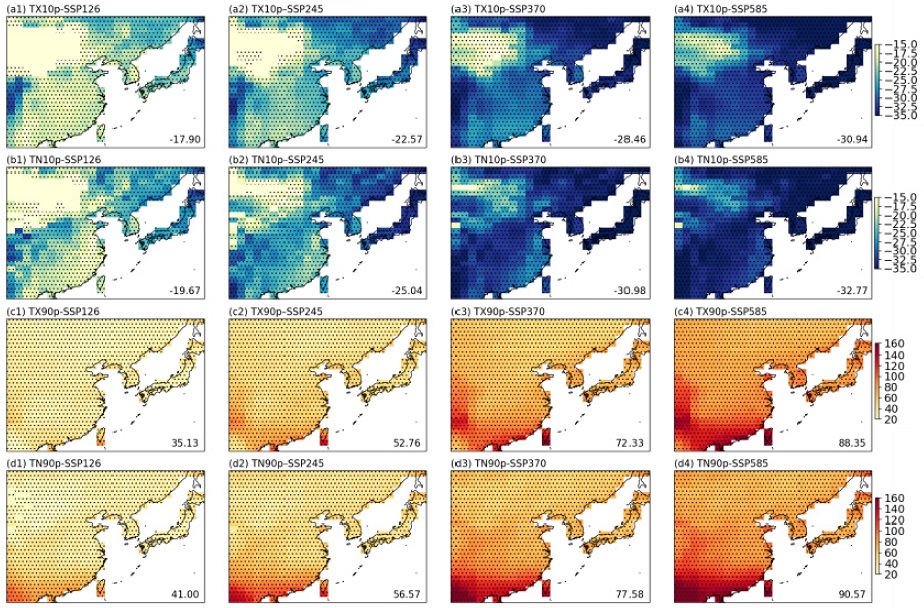
Spatial distributions of the annual mean extreme temperature frequency indices: (a1-a4) TX10p, (b1-b4) TN90p, (c1-c4) TX90p, (d1-d4) TN90p during 2080 ~ 2100 over East Asia from (a1-d1) SSP1-2.6, (a2-d2) SSP2-4.5, (a3-d3) SSP3-7.0, (a4-d4) SSP5-8.5 scenario relative to the present-day mean (1995 ~ 2014). Black dotted grids represent the changes are statistically significant at 1% level. The domain average value is shown in the low right corner.
3.3 극한강수지수 미래전망
동아시아 지역은 몬순시스템의 영향으로 여름철에 강수가 집중되는 특징으로 인해, 극한 강수의 변화는 홍수와 가뭄 발생과 밀접하게 관련되어 있을 뿐만 아니라 수자원 및 식량문제에 다양한 영향을 미칠 수 있다. 따라서 강수 극한지수의 미래전망 분석은 광범위한 활용이 가능하다. 먼저 강수 강도의 극한지수인 Rx1day와 Rx5day의 미래 변화를 살펴보면, 온난화 수준이 높아짐에 따라 평균 강수량의 증가로 인해 강수 강도도 전반적으로 증가 경향이 나타나고 있다(Fig. 11a). 한반도의 경우 시나리오에 따른 극한강수 강도의 증가 경향은 동아시아 지역과 유사한 수준이 나타났으나, 앙상블 간 편차가 크게 나타나 한반도 극한강수 미래전망의 불확실성은 높은 것으로 판단된다(Fig. A3a). 현재 대비 21세기 후반의 동아시아 강수 강도는 Rx1day가 약 12 ~ 34 mm 증가하였으며 Rx5day는 약 22 ~ 58 mm 증가할 것으로 전망되었다. 21세기 중반까지는 시나리오에 따른 강수량 변화의 차이는 크지 않았다(Fig. 7i,j). 하지만 온실가스 배출이 감소하는 저탄소 시나리오인 SSP1-2.6과 SSP2-4.5에서 21세기 말까지 기후가 안정되면서 강수 증가도 완만해지는 경향이 나타났다. 반면, 온실가스 배출이 지속적으로 증가하는 SSP3-7.0과 SSP5-8.5의 경우 뚜렷한 강수 증가 경향이 나타나는 등 앞서 극한기온지수들(TXx, TNn, TNx, TNn)과 유사한 양상을 보였다(Fig. 7a-d).
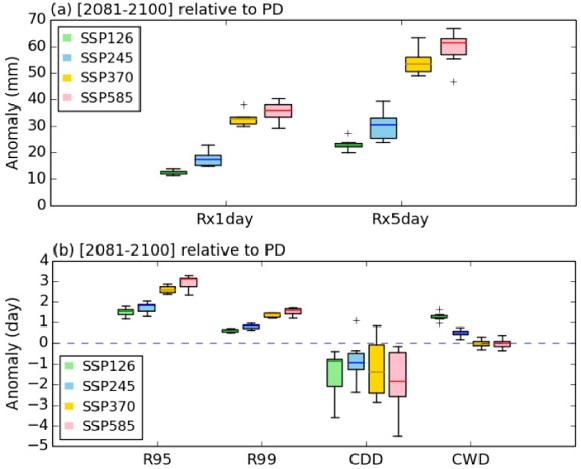
Changes in extreme precipitation intensity, frequency and duration indices: (a) Rx1day, Rx5day, (b) R95, R99, CDD, CWD for the late 21st centuray (2081 ~ 2100) relative to the present-day mean (1995 ~ 2014). Each color denotes a different SSP scenario and the boxes and whiskers indicate the interquartile model spread (range between the 25th and 75th percentiles) and the total ensemble range, respectively.
21세기 후반 극한강수량 지수의 지역별 변화 경향은 유사한 분포를 보였다. 현재 기후에서 평균 강수량이 높게 나타난 중국 남부와 일본 및 우리나라와 만주 지역에서 증가 경향이 나타났다(Fig. 3, Fig. 12). 특히 온난화 수준이 높아짐에 따라 이러한 경향은 강해졌으며 통계적으로도 유의미한 지역이 증가하였다. 따라서 중국 북부 지역을 제외하면 동아시아 전반에 걸쳐 강수 강도가 강해질 것으로 전망된다. 이는 온난화 수준에 따라 중국 남부 및 우리나라를 포함한 동아시아 몬순 강수량이 점차 증가할 것이라는 선행연구들과 일치하는 결과이다(Su et al., 2021; Moon and Ha, 2020; Shin et al., 2020; Sung et al., 2020).
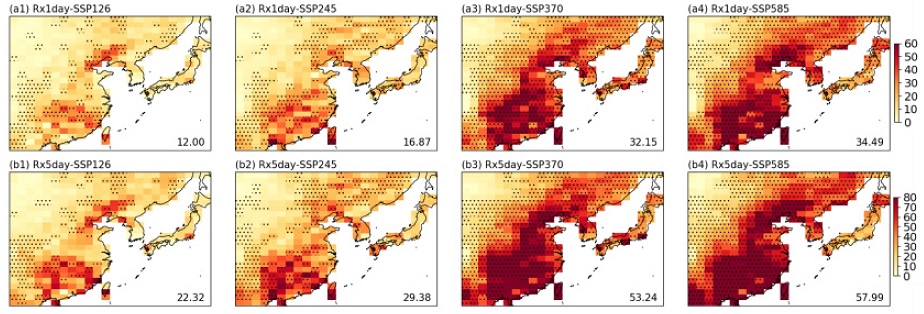
Spatial distributions of the annual mean extreme precipitation intensity indices: (a1-a4) Rx1day (b1-b4) Rx5day during 2080-2100 over East Asia from (a1-b1) SSP1-2.6, (a2-b2) SSP2-4.5, (a3-b3) SSP3-7.0, (a4-b4) SSP5-8.5 scenario relative to the present-day mean (1995 ~ 2014). Black dotted grids represent the changes are statistically significant at 1% level. The domain average value is shown in the low right corner.
동아시아와 한반도 지역의 극한강수 발생 빈도와 관련된 퍼센타일 지수(R95, R99)의 변화 경향도 극한강수 강도와 마찬가지로 뚜렷한 증가 경향이 나타났다(Fig. 7k,l, Fig. 11b, Fig. A3b). 95퍼센타일의 강수일수(R95)와 99퍼센타일의 강수일수(R99)의 발생 빈도가 현재 대비 21세기 말 각각 1.6 ~ 3.1일과 0.6 ~ 1.6일 증가할 것으로 전망되었다. 특히 이러한 빈도 증가는 앞서 극한강수량 증가와 유사한 지역에서 통계적으로 유의미한 증가가 나타났다(Fig. 13a,b). 특히 중국 남부지역은 극한강수의 강수량과 발생 빈도가 모두 증가하고 있어 온난화에 따른 집중호우의 피해가 커질 것으로 예상된다.
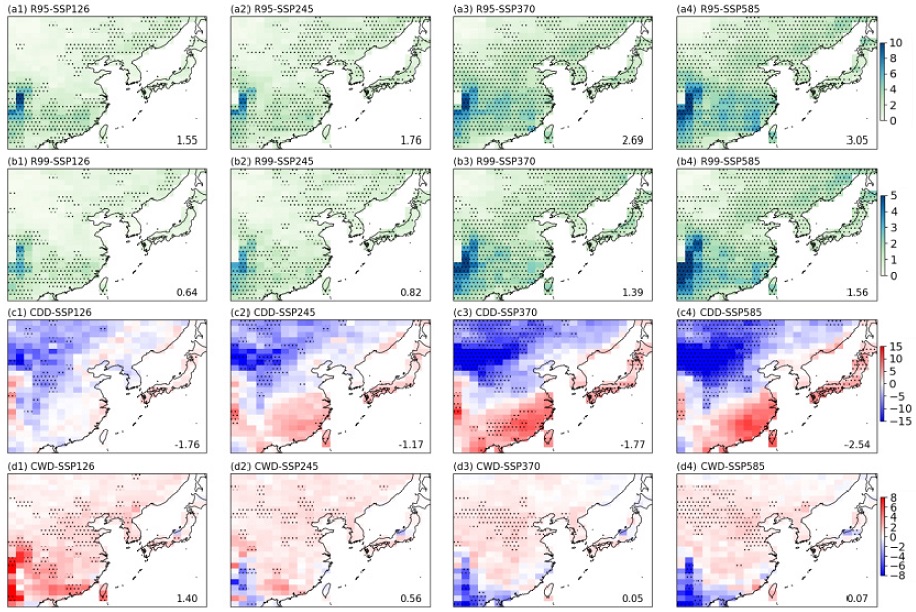
Spatial distributions of the annual mean extreme precipitation frequency and duration indices: (a1-a4) R95, (b1-b4) R99, (c1-c4) CDD, (d1-d4) CWD during 2080-2100 over East Asia from (a1-d1) SSP1-2.6, (a2-d2) SSP2-4.5, (a3-d3) SSP3-7.0, (a4-d4) SSP5-8.5 scenario relative to the present-day mean (1995 ~ 2014). Black dotted grids represent the changes are statistically significant at 1% level. The domain average value is shown in the low right corner.
강수의 지속일수와 관련된 연속무강수일수(CDD)와 연속강수일수(CWD)의 경우 시나리오에 따른 변화 경향이 뚜렷하지 않았다(Fig. 7m,n, Fig. 11b). CDD의 경우 앙상블간 큰 편차를 통해 모델의 내부 변동성에 의한 불확실성이 큰 것을 확인하였으며, CWD의 경우 대부분 1일 이내로 나타나 뚜렷한 경향을 판단하기 어려웠다. 그러나 CDD의 미래 변화를 지역별로 살펴보면 상대적으로 건조한 지역인 30°N 이북의 내륙 지역에서는 통계적으로 유의미한 감소 일수가 나타났으며, 반대로 습윤한 지역인 중국 남부와 해안과 인접한 일본 및 우리나라에서는 증가 경향이 나타나 상반된 경향을 보였다(Fig. 13c, Fig. A3b). 선행연구에 따르면 중국 지역에서의 CDD의 남북패턴 차이는 온난화 시나리오에 따라 중국 남부지역의 총 강수일수는 감소하여 강수가 집중되는 특징이 나타나지만, 북부지역에서는 총 강수일수가 증가함에 따라 이러한 차이가 발생시키는 것으로 추정된다(Zhou et al., 2014). CWD의 경우 중국 남부지역에서 유의미한 감소를 제외하고는 대부분 지역에서는 약한 증가 경향이 나타났으나 통계적인 신뢰도는 낮았다(Fig. 13d).
4. 요약 및 결론
본 연구는 IPCC AR6 대응을 위해 새롭게 산출된 국가 기후변화 표준 시나리오를 기반으로 수행되었으며, 동아시아 지역의 기온과 강수에 대한 극한기후의 변화를 살펴보았다. NIMS-KMA 지구시스템모델의 모의성능을 확인하기 위해 현재 기후의 일최고기온, 일최저기온, 일강수량 및 8개의 기온극한지수와 6개의 강수극한지수를 ERA5 재분석자료와 비교하였다. 그 결과, 연평균 일최고/최저 기온과 강수량의 공간분포는 모델과 재분석자료가 유사하게 나타났으나, 모델에서 모의된 일최고/최저 기온은 중국 내륙과 고위도에서 음의 편차가 나타났으며 강수량은 중국 남부 습윤지역에서 양의 편차가 나타났다. 계절적으로는 중국 동부 및 만주 지역에서 양의 편차가 나타난 여름철 일최고 기온을 제외하면 전반적으로 연평균 기온 분포와 유사하게 음의 편차를 보였다. 여름철 강수는 중국 남부지역에서 겨울철 강수는 중국 남동부 해안에서 뚜렷한 양의 편차가 나타났다.
모델 앙상블 결과로부터 계산한 현재기후의 기온과 강수 극한지수를 재분석자료와 관측자료와 비교한 결과, TXx, TNx의 경우 관측자료와 유사한 결과를 얻었으나 재분석자료와는 약한 편차가 나타났다. TXn, TNn의 경우는 모델이 관측과 재분석자료에 비해 다소 과소모의하는 경향이 나타났다. 특히 강수와 관련된 극한지수는 극한기온과 비교해 상대적으로 편차가 컸다. 강수의 강도와 관련된 Rx1day는 관측과 유사하게 나타났지만 Rx5day에서는 다소 과대모의 경향을 보였으며 재분석자료와의 편차가 컸다. 반대로 강수의 지속시간과 관련된 극한지수에서는 재분석자료와 유사한 결과를 얻었으나 관측에 비해 큰 편차가 나타나고 있어 극한강수의 미래 전망에 있어 해석에 주의가 필요하다.
전지구 및 동아시아 온난화에 따른 극한기후의 미래 변화를 정량적으로 예측하기 위해 SSP 시나리오별 ETCCDI 지수를 분석하였다. 극한기온의 강도와 관련된 지수들은 모든 시나리오에서 증가경향이 나타났고, 고탄소 시나리오에서는 21세기 후반으로 갈수록 증가 경향이 가속화 되는 것으로 나타났다. 이러한 변화는 주로 위도 40°N 이상의 고위도에서 뚜렷한 증가 경향을 보였다. 또한, 한랭일과 한랭야와 같은 극한저온의 발생 빈도는 현재대비 90% 이상 줄어드는 것으로 전망되었으며, 온난일과 온난야의 경우 21세기 말에는 현재 대비 최대 90일 이상 증가할 것으로 나타났다. 이러한 결과를 통해 폭염과 같은 극한고온 현상이 미래에 더 강하고 빈번하게 발생할 것이며, 한파와 같은 극한저온 현상은 약해질 뿐만 아니라 출현 빈도도 크게 감소할 것으로 분석되었다.
강수의 강도 또한 기온과 유사하게 모든 시나리오에서 21세기 말에 큰 폭으로 증가 경향이 나타났다. 특히 동아시아 강수량이 큰 중국 남부와 한반도, 일본에서 유의미한 증가 경향을 보였다. 또한, 극한강수의 빈도 또한 30°N 이하의 피크 지역에서 증가하는 것으로 나타났다. 강수의 지속시간과 관련된 연속무강수일수와 연속강수일수의 변화는 모델 앙상블간 편차가 클 뿐만 아니라 시나리오별 변화가 크지 않았다. 하지만 연속무강수일수의 경우 30°N 이북의 내륙 지역에는 통계적으로 유의미한 감소 일수가 나타났으며, 반대로 중국 남부 및 일본에서는 뚜렷한 증가 경향이 나타나 상반된 경향을 보였다. 따라서 중국 남부지역에서의 최대강수량은 증가하고 강한 강수의 빈도도 증가할 것으로 나타났으나, 연간 무강수일수는 오히려 증가하고 있어 먼 미래 집중호우 형태의 극한강수의 발생이 커질 것으로 판단된다. 하지만 모델이 모의한 평균 강수량이 재분석 자료와 비교해서 다소 과대 모의할 뿐만 아니라, 지속일수와 관련된 지수의 변화는 불확실성이 높고 통계적 유의성이 낮아 해석에 주의가 필요하다.
한반도의 경우 동아시아 분석과 전반적으로 유사한 경향을 보였으나(Fig. A1-A3), 이는 모델과 격자 개수의 한계 때문에 제한적인 분석결과이며 특히 강수지수의 경우 모델 앙상블 간 편차가 컸다. 이러한 국지적인 극한기후 변화에 대한 불확실성을 줄이기 위해, 향후 보다 고해상도의 전지구 또는 지역 기후모델 간 비교 분석이 요구된다. 또한, 분석결과가 선행연구의 AR5 RCP 시나리오에 따른 극한기후 변화와 유사한 경향을 확인하였다(Zhou et al., 2014; Chen et al., 2018). 하지만, 분석에 사용한 모델과 배출량의 차이뿐만 아니라 미래 전망에 있어 기준기간과 영역에 차이가 있으므로 본 연구에서는 정량적인 비교를 수행할 수 없었으나, 향후 RCP 시나리오 자료에 대한 분석을 포함해 보강되어야 할 것이다.
본 연구 결과는 국립기상과학원 지구시스템모델 UKESM1과 K-ACE를 이용하여 분석한 결과로써 모델과 내부변동성에 대한 불확실성을 줄이고자 6개의 앙상블 평균값을 이용하였다. 선행연구에 따르면 NIMS-KMA 모델은 주요 기후요소에 대해 CMIP5 모델 대비 동아시아 지역에서 우수한 재현수준으로 평가되고 있으나(Sung et al., 2020), 전반적으로 CMIP6 모델의 평형기후민감도(ECS, Equilibrium Climate Sensitivity)와 점증기후반응(TCR, Transient Climate Response)이 CMIP5 모델 대비 증가하였다(Zelinka et al., 2020; Flynn and Mauritsen, 2020). 그중에서도 NIMS-KMA 모델은 이러한 기후 민감도가 다른 모델들에 비해 높은 수준으로 나타났다(Sun et al., 2020). 그뿐만 아니라 두 모델 모두 같은 역학 모델과 물리과정을 사용하고 있으므로, 향후 CMIP6 모델들과의 비교 및 불확실성 평가가 추가되어야 할 것이다. 그리고 강수 강도의 변화 경향이 시나리오에 따라 선형적으로 증가하지 않았으며, 강수일수의 경우 지역별 큰 차이가 나타났다. 따라서 향후 몬순시스템과 관련된 대규모 순환 및 강수 영향에 대한 분석이 추가되어야 할 것으로 생각된다. 본 연구를 통해 도출된 동아시아 극한기후 분석결과는 폭염, 한파 및 집중호우 같은 극한기상 현상에 대한 피해방지와 국가 기후변화 적응정책 수립의 과학적 기반자료로 활용될 수 있을 것으로 기대된다.
Acknowledgments
이 연구는 기상청 국립기상과학원 「기상업무지원기술개발연구」 “AR6 기후변화 시나리오 개발·평가(KMA2018-00321)”의 지원으로 수행되었습니다.
References
-
Chen S, Jiang Z-H, Chen W-L, Li L. 2018. Changes in temperature extremes over China under 1.5℃ and 2℃ global warming targets. Adv. Clim. Change. Res. 9(2): 120-129.
[https://doi.org/10.1016/j.accre.2017.11.003]

-
Chen C-A, Hsu H-H, Liang H-C. 2021. Evaluation and comparison of CMIP6 and CMIP5 model performancee in simulating the seasonal extreme precipitation in the Western North Pacific and East Asia. Weather and Climate Extremes, 31: 100303.
[https://doi.org/10.1016/j.wace.2021.100303]

-
Cheong WK, Timbal B, Golding N, Sirabaha S, Kwan KF, Cinco TA, Archevarahuprok B, Vo VH, Gunawan D, Han S. 2018. Observation and modelled temperature and precipitation extremes over Southeast Asia from 1972 to 2010. Int J Climatol 38: 3013-3027.
[https://doi.org/10.1002/joc.5479]

-
Ciccarelli N, von Hardenberg J, Provenzale A, Ronchi C, Vargiu A, Pelosini R. 2008. Climate variability in north-western Italy during the second half of the 20th century. Global and Planetary Change, 62(2-3): 185-195.
[https://doi.org/10.1016/j.gloplacha.2008.03.006]

- Dunn RJH, Alexander LV, Donat MG, Zhang X, Bardor M, Herold N, Lippmann T, Allan R, et al., 2020. Development of an updated global land in-situ-based dataset of temperature and precipitation extremes: HadEX3. J. Geophys. Res. Atmos. 125(16): e2019JD032263.
-
Eyring V, Bony S, Meehl GA, Senior C, Stevens B, Stouffer BJ, Taylor KE. 2016. Overview of the Coupled Model Intercomparison Project Phase 6 (CMIP6) experimental design and organization. Geosci Model Dev 9: 1937-1958.
[https://doi.org/10.5194/gmd-9-1937-2016]

-
Freychet N, Hsu HH, Wu CH. 2016. Extreme precipitation events over East Asia: evaluating the CMIP5 model, Atmospheric hazards: Case studies in modeling, communication and societal impacts. 87-109.
[https://doi.org/10.5772/62996]

- Heo TK, Kim Y, Boo K-O, Byun Y-H, Cho C. 2018. Future sea level projections over the seas around Korea from CMIP5 simulations. Atmosphere 28(1): 25-35 (In Korean).
-
Hong Y, and Ying S. 2018. Characteristics of extreme temperature and precipitation in China in 2017 based on ETCCDI indices. Advanced in Climate Change Research 9: 218-226.
[https://doi.org/10.1016/j.accre.2019.01.001]

-
Lee K, Baek H-J, Cho C. 2014. Future projection of changes in cooling and heating degree days in Korea. Journal of Climate Research 9(1): 1-13 (In Korean).
[https://doi.org/10.14383/cri.2014.9.1.1]

-
Lee J, Kim J, Sun M-A, Kim B-H, Moon H, Sung H-M, Kim J, Byun Y-H. 2019. Evaluation of the Korea Meteorological Administration Advanced Community Earth-System model (K-ACE). Asia-Pacific J Atmos Sci 56: 381-395.
[https://doi.org/10.1007/s13143-019-00144-7]

-
Lee JH, Sung HM, Shim S, Boo K-O. 2020. International data node system for CMIP6 climate change projections. Journal of Climate Change Research 11(4): 247-257 (In Korean).
[https://doi.org/10.15531/KSCCR.2020.11.4.247]

- Hwang S, Cho J, Yoon KS. 2018. Assessing the skills of CMIP5 GCMs in reproducing spatial climatology of precipitation over the coastal area in East Asia. J. Korea Water Resour. Assoc. 51(8): 629-642 (In Korean).
- IPCC. 2014. Climate Change 2014: Synthesis Report. In Contribution of Working Group I, II, and III to the Fifth Assessment Report of the Intergovernmental Panel on Climate Change. Cambridge University Press: Cambridge, UK; New York, NY, USA: 1–151.
- IPCC. 2018. Global warming of 1.5℃. An IPCC Special Report on the impacts of global warming 1.5℃ above pre-industrial levels and related global greenhouse gas emission pathways, in the context of strengthening the global response to the threat of climate change, sustainable development, and effects to eradicate poverty. Masson-Delmotte V. et al. (ed). World Meteorological Organization: 1-32.
- KEI (Korea Environment Institute). 2011. Economic analysis of climate change in Korea (In Korean).
- KMA (Korea Meteorological Administration). 2012. The prospect report of climate change in Korea peninsula (In Korean).
-
Kim J, Kwon W-T, Byun Y-H. 2015. Monthly changes in temperature extremes over South Korea based on observations and RCP8.5 Scenario. Journal of Climate Change Research 6(2): 61-72 (In Korean).
[https://doi.org/10.15531/ksccr.2015.6.2.61]

-
Kim J, Kim K-R, Kim B-J. 2015. The occurrence characteristic and future prospect of extreme heat and tropical night in Daegu and Jeju. Journal of Environmental Science International 24(11): 1493-1500.
[https://doi.org/10.5322/JESI.2015.24.11.1493]

- Kim J, Boo K-O, Choi J, Byun Y-H. 2018. Climate change in the Korean peninsula over the last 100 years. National Institute of Meteorological Sciences (In Korean).
-
Kim YH, Min SK, Zhang X, Sillmann J, Sandstad M. 2020. Evaluation of the CMIP6 multi-model ensemble for climate extreme indices. Weather and Climate Extremes 29(2020): 100269.
[https://doi.org/10.1016/j.wace.2020.100269]

- Kwon SH, Boo K-O, Shim S, Byun Y-H. 2017. Evaluation of the East Asian Summer Monsoon season simulated in CMIP5 models and the future change. Atmosphere 27(2): 131-150.
-
Moon S, and Ha K-J. 2020. Future changes in monsoon duration and precipitation using CMIP6. npj Clim Atmos Sci 3: 45.
[https://doi.org/10.1038/s41612-020-00151-w]

-
O’Neill BC, Kriegler E, Riahi K, Ebi KL, Hallegatte S, Carter TR, Mathur R, Vuuren DP. 2014. A new scenario framework for climate change research: the concept of shared socioeconomic pathways. Climatic Change 122(3): 387-400.
[https://doi.org/10.1007/s10584-013-0905-2]

-
O’Neill BC, Kriegler E, Ebi KL, Kem-Benedict E, Riahi K, Rothman DS, Ruijven BJ, Vuuren DP, Birkmann J, Kok K, Levy M, Solecki W. 2017. The roads ahead: Narratives for shared socioeconomic pathways describing world futures in the 21st century. Global Environ Change 42: 169-180.
[https://doi.org/10.1016/j.gloenvcha.2015.01.004]

-
Sellar AA, Walton J, Jones GC, Wood R, Abraham LN, Archibald TA, Dyson H, Elkington M, Ellis R, Florek P, Good P, Gohar L, Haddad S, Hardiman CS, Hogan E, Iwi A, Jones DC, Johnson B, Kelley ID, Kettleborough J, Knight RJ, Kohler OM, Kuhlbrodt T, Liddicoat S, Linova-Pavlova I, Mizielinski S, Morgenstern O, Mulcahy J, Neininger E, O’Connor MF, Petrie R, Ridley J, Rioual J-C, Roberts E, Rumbold S, Seddon J, Shepherd H, Shim S, Stephens A, Teixeira CJ, Tang Y, Collins W, Wiltshire A. 2020. Implementation of UK Earth system models for CMIP6. JAMES 12: e2019MS001946.
[https://doi.org/10.1029/2019MS001946]

- Shim S, Kwon S-H, Lim Y-J, Yum SS, Byun Y-H. 2019. Understanding climate change over East Asia under stabilized 1.5 and 2.0℃ global warming scenarios. Atmosphere 29(4): 391-401 (In Korean).
- Shim S, Seo J, Kwon SH, Lee J-H, Sung H-M, Boo K-O, Byun Y-H, Lim Y-J, Kim Y-H. 2020. Impact of Future Air Quality in East Asia under SSP Scenarios, Atmosphere 30(4): 439-454 (In Korean).
-
Shin Y, Shin Y, Hong J, Kim M-K, Byun Y-H, Boo K-O, Chung I-U, Park D-S, Park J-S. 2021. Future Projections and Uncertainty Assessment of Precipitation Extremes in the Korean Peninsula from the CMIP6 Ensemble with a Statistical Framework. Atmosphere, 12(1): 97.
[https://doi.org/10.3390/atmos12010097]

-
Sillmann J, Kharin VV, Zhang X, Zwiers FW, Dronaugh D. 2013. Climate extremes indices in the CMIP5 multimodel ensemble: Part 1. Model evaluation in the present climate. J. Geophys. Res. Atmos., 118: 1716-1733.
[https://doi.org/10.1002/jgrd.50203]

-
Srivastava A, Grotjahn R, Ullrich PA. Evaluation of historical CMIP6 model simulations of extreme precipitation over contiguous US regions. Weather and Climate Extremes, 29: 100268.
[https://doi.org/10.1016/j.wace.2020.100268]

-
Stephens GL, L’Ecuyer T, Forbes R, Gettelmen A, Golaz JC, Bodas-Salcedo A, Suzuki K, Gabriel P, Haynes J. 2010. Dreary state of precipitation in global models. J. Geophys. Res. 115: D24211.
[https://doi.org/10.1029/2010JD014532]

-
Su B, Huang J, Mondal SK, Zhai J, Wang Y, Wen S, Gao M, Lv Y, Jiang S, Jiang T, Li A. 2021. Insight from CMIP6 SSP-RCP scenarios for future drought characteristics in China. Atmospheric Research, 250: 105375.
[https://doi.org/10.1016/j.atmosres.2020.105375]

-
Sun M-A, Sung HM, Kim J, Boo K-O, Lim Y-J, Mzrzin C, Byun Y-H. 2020. Climate Sensitivity and Feedback of a New Coupled Model (K-ACE) to Idealized CO2 forcing. Atmosphere, 11: 1218.
[https://doi.org/10.3390/atmos11111218]

-
Sung H-M, Kim J, Shim S, Seo J-B, Kwon S-H, Sun M-A, Moon H, Lee J-H, Lim Y-J, Boo K-O, Kim Y, Lee J, Lee J, Kim J-S, Marzin C, Byun Y-H. 2020. Climate change projection in 21st century simulated by NIMS-KMA CMIP6 model based on new GHGs concentration pathways. Asia-Pacific J Atmos Sci.
[https://doi.org/10.1007/s13143-021-00225-6]

-
Sung H-M, Kim J, Lee J-H, Shim S, Boo K-O, Ha J-C, Byun Y-H. 2021. Future change in the global and regional sea level rise and sea surface temperature based on CMIP6 models. Atmosphere 12: 90.
[https://doi.org/10.3390/atmos12010090]

-
Takeshima A, Kim H, Shiogama H, Lierhammer L, Scinocca JF, Seland O, Mitchell D. 2020. Global aridity changes due to differences in surface energy and water balance between 1.5℃ and 2℃ warming. Environ Res Lett 15: 0940a7.
[https://doi.org/10.1088/1748-9326/ab9db3]

-
Wang S, Mcgrath R, Semmler T, Sweeney C. 2005. Validation of simulated precipitation patterns over Ireland for the period 1961-2000. International Journal of Climatology. 26(2): 261-266.
[https://doi.org/10.1002/joc.1246]

- World Meteorological Organization (WMO). 2009. Guidelines on analysis of extremes in a changing climate in support of informed decisions for adaptation. Climate data and monitoring: WCDMP-No.72.
-
Zhou B, Wen QH, Xu Y, Song L, Zhang X. 2014. Projected Changes in Temperature and Precipitation Extremes in China by the CMIP5 Multimodel Ensembles. Journal of Climate 27: 6591-6611.
[https://doi.org/10.1175/JCLI-D-13-00761.1]

-
Zelinka MD, Myers TA, McCoy DT, Po-Chedley S, Caldwell PM. Ceppi P, Klein SA, Taylor KE. 2020. Causes of higher climate sensitivity in CMIP6 models. Geophys. Res. Lett. 47: e2019GL085782.
[https://doi.org/10.1029/2019GL085782]

Appendix
부록
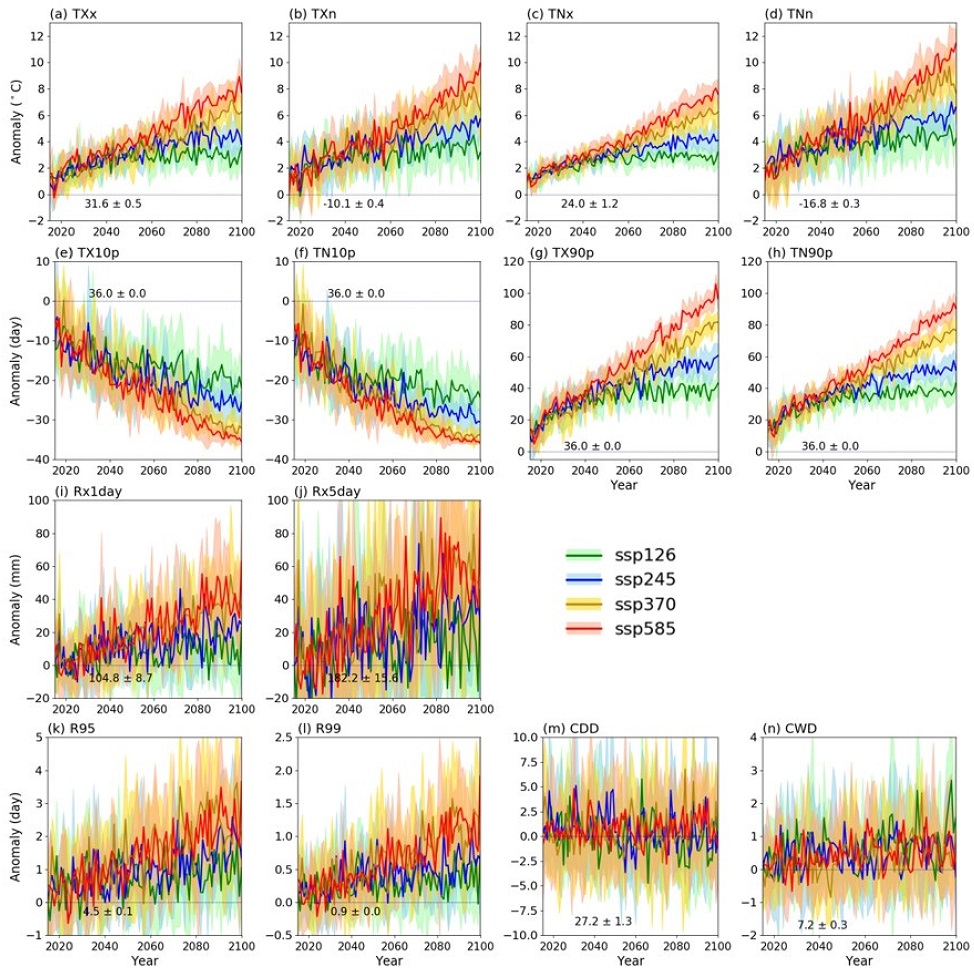
Change in anomaly series of extreme climate indices averaged over Korea peninsula (33.5-42.0°N, 124-132°E) during 2015-2100 from the SSP scenarios. The dotted reference lines and values denote the ensemble mean value (± 1 standard deviation) for the years 1995 ~ 2014 in each plots.
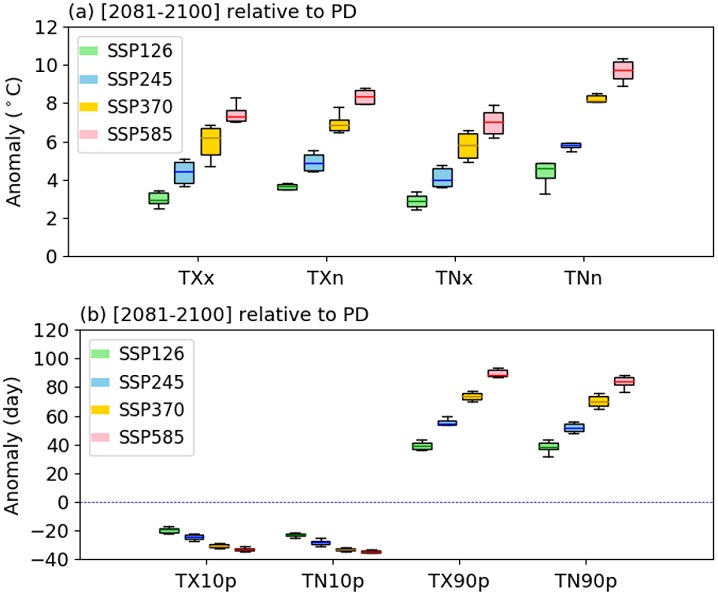
Changes in extreme temperature intensity and frequency indices over Korea peninsula (33.5-42.0°N, 124-132°E): (a) TXx, TNx, TXn, TNn, (b) TX10p, TN10p, TX90p, TN90p for the late 21st centuray (2081 ~ 2100) relative to the present-day mean (1995 ~ 2014). Each color denotes a different SSP scenario and the boxes and whiskers indicate the interquartile model spread (range between the 25th and 75th percentiles) and the total ensemble range, respectively.
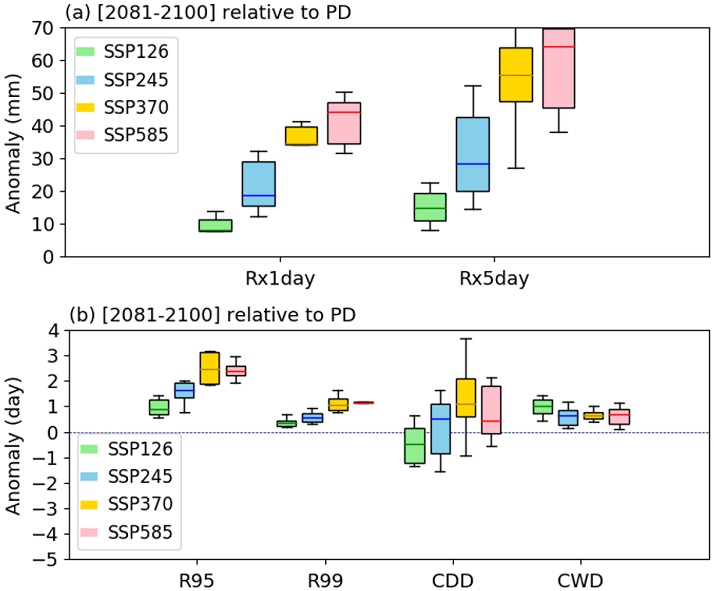
Changes in extreme precipitation intensity, frequency and duration indices over Korea peninsula (33.5-42.0°N, 124-132°E): (a) Rx1day, Rx5day, (b) R95, R99, CDD, CWD for the late 21st centuray (2081 ~ 2100) relative to the present-day mean (1995 ~ 2014). Each color denotes a different SSP scenario and the boxes and whiskers indicate the interquartile model spread (range between the 25th and 75th percentiles) and the total ensemble range, respectively.
