Evaluation of Short-Term CO2 Passive Sampler for Monitoring Atmospheric CO2 Levels
Abstract
In this study, we investigated the applicability of a short-term carbon dioxide (CO2) passive sampler using turbidity change in a solution containing barium hydroxide (Ba(OH)2). The mass of CO2 introduced into the Ba(OH)2 aqueous solution was strongly correlated (r2= 0.9565) to the change in turbidity caused by its reaction with the solution. The sampling rates calculated for 1 h and 24 h were 42.4±5.4 mL min-1 and 2.3±0.3 mL min-1, respectively. Both unexposed (blank) and exposed samplers remained stable during the storage period of at least two weeks. The detection limits of the passive sampler for CO2 were 81.5 ppm for 1 h and 61.5 ppm for 24 h. Based on the results, the passive sampler using the change of turbidity in the Ba(OH)2 aqueous solution appears to be a suitable tool for measuring short-term atmospheric concentrations of CO2.
Keywords:
Carbon Dioxide, Barium Hydroxide, Turbidity, Passive Sampler, Sampling Rate1. INTRODUCTION
According to the 5th assessment report of the Intergovernmental Panel on Climate Change (IPCC), global mean temperature has increased by approximately 0.89℃ over the past 112 years (1901∼2012). In the 20th century, the average rate of global mean sea level rise has been approximately 1.7 mm yr-1. If the current trend in the emission of greenhouse gases continues, the increase in global mean temperature and rise in sea level by the end of the 21st century (2081∼2100) is likely to be 3.7 ℃ and 63 cm, respectively (IPCC, 2013), under representative concentration pathways (RCP) 8.5. CO2 has a significant influence on climate change although its composition ratioin the atmosphereis less than 1%. A high concentration of CO2 in an indoor environment could cause dyspnea and has other serious impacts on human health (OECD/IEA, 2014). The long-term trends in climate change caused by the acceleration of global warming and the management of indoor air quality need to be considered. Therefore, continuous monitoring of CO2 concentrations in indoor and outdoor air is important for the establishment and management of counter measures for the improvement of indoor and outdoor air quality in the future.
Studies have been conducted on the continuous variation of CO2 concentration in the atmosphere (James et al., 1982; Kirk et al., 1989; Aikawa et al., 1995; Reid and Steyn, 1997), and the characteristic evaluation of CO2 concentration in the city (Idso et al., 2001; Idso et al., 2002; Gratani and Varone, 2005). The measurement of CO2 concentration in the atmosphere has mainly been carried out using a continuous measurement device (i.e., active and automatic sampler) such as a non-dispersive infrared analyzer. This method has the advantage of permitting in-situ determination of CO2 concentrations with accuracy and precision. However, a large number of analytical measurement devices would need to be deployed to provide detailed spatial and temporal data (George et al., 2007). Therefore, a cost and time-effective approach for measuring atmospheric pollutants needs to be considered.
The passive sampler, with high resolution, low cost, and easy operability, can be used for the investigation of the spatial distribution of air pollutant concentrations. Many passive samplers have been developed recently for measuring various air pollutants and are used to monitor ambient air, indoor air, and the workplace atmosphere. Because they do not require a power supply, and are relatively inexpensive, small, light, and noiseless, the passive sampler have some advantages compared to a continuous measurement device. They are particularly ideal for personal and indoor/outdoor monitoring. They have frequently been used to monitor and evaluate the spatial distribution of air pollutants, because the passive sampler can accurately and directly measure pollutants in the atmosphere. In particular, compared with those of a continuous measurement device, the passive sampler do not require pumps and flow meters and costs are likely to be low (UNEP/WHO, 1994; Gillett et al., 2000; Tsai and Hee, 2000; Kousa et al., 2001; Rabaud et al., 2001; Stevenson et al., 2001; Carmichael et al., 2003; Cruz et al., 2004; Harner et al., 2006; Kume et al., 2008).
The absorption reaction of CO2 in Ba(OH)2 aqueous solution was used to quantify atmospheric CO2 using a passive sampler. After sampling, the changes in the amount of barium in the absorption solution were analyzed using ICP-AES (Inductively coupled plasma atomic emission spectroscopy) (Bertoni et al., 2004). These passive sampling and analysis methods are inadequate to describe short-term variations in CO2 concentration because the sampling rates of these passive samplers are somewhat low (about 0.21 mL min-1).
This study aimed to evaluate the passive sampler as a device for measuring short-term atmospheric CO2 concentration using the turbidity change in a Ba(OH)2 aqueous solution, which was measured using a portable turbidometer. In addition, we focused on estimating the applicability of the short-term CO2 passive sampler through simultaneous measurements using an active sampling device as a reference technique.
2. EXPERIMENTAL
2.1 Passive Sampler and Chemicals
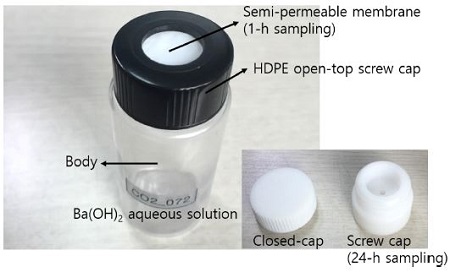
Atmospheric CO2 was collected in a passive sampler containing an absorption reagent. For preparing the Ba(OH)2 aqueous solution as the absorption reagent, 3 mL of Ba(OH)2 solution (0.3 N, Sigma-Aldrich, USA) was made up to 100 mL with the addition of pure water, which had been purified using a ultrapure water system (resistivity > 18 MΩcm). In order to minimize the effect of CO2 present in pure water, the pure water was boiled at 100℃ and cooled to room temperature. The turbidity of the absorption reagent produced was 1.2 ±0.1 NTU (Nephelometry Turbidity Unit). As a shown in Fig. 1, the passive sampler consists of a Pyrex glass body (24 mm ∅, 50 mm height), and a high-density polyethylene open-top screw cap (24 mm ∅, 11 mm height) installed with a semipermeable membrane (12 mm ∅for 1-h sampling and 2 mm ∅for 24-h sampling, Celgard-2500, Celgard LLC, USA), in order to control the sampling rates. The semi-permeable membrane has a porosity of 55%, a pore size of 0.209 μm × 0.054 μm, and a thickness of 25 μm. All parts of the passive sampler used for experiments, except the semi-permeable membrane, were thoroughly cleaned with pure water, using an ultrasonic cleaner bath (ultrasonic frequency 40 kHz, ultrasonic power 200 W, Seong Dong, Korea), and were then allowed to dry at room temperature. After drying, the components were stored in a clean environment to prevent the accumulation of dust or other contaminants. The passive samplers were handled very carefully before and after use as they are easily contaminated in atmosphere containing CO2.
2.2 Measurement Principle and Analysis
As a shown in Eq. (1) and (2), atmospheric CO2 is readily dissolved in the Ba(OH)2 aqueous solution. An insoluble carbonate salt, (BaCO3), is then formed by the reaction of barium ions (Ba2+) and carbonate ions(CO32-) in the aqueous solution. Thus, the change in turbidity of the aqueous solution is caused by the precipitation of carbonate salt. The concentration of atmospheric CO2 is calculated from the relationship between the mass of the absorbed CO2 and the turbidity measured before and after sampling. The change in turbidity is consistent with the amount of absorbed CO2. This change is investigated using nephelometry, a method for the measurement of scattered light in turbid media, using a portable turbidometer (2100Q, Hach, USA).
| (1) |
| (2) |
For assessing the accuracy of the CO2 measurement data obtained from the passive sampler, the reference method (active device sampling method) in this study employed a nondispersive infrared (NDIR) CO2 analyzer (SLC, Korea) calibrated with CO2-in-N2 reference gases (3,007 ppm/N2, Air Korea, Korea).
3. RESULTS AND DISCUSSION
3.1 Calibration of the NDIR CO2 Analyzer
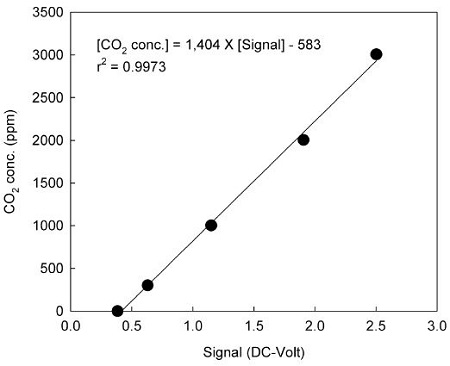
The improvement of accuracy of the NDIR CO2 analyzer is significant in a comparative experiment with the passive sampler. The calibration of the NDIR CO2 analyzer was carried out using CO2-in-N2 reference gases. The CO2 standard gas was diluted stepwise with N2 (99.999%) using 3 L polyethylene bags to achieve CO2 concentrations ranging from 0 to 3,007 ppm. Each diluted sample was measured using the NDIR CO2 analyzer and all measurements were performed in triplicate. Data were means of these experiments and relative standard deviation (RSD) was be low 5%. The relationship between the DC-Volt signals (max. = 5 V) of the NDIR CO2 analyzer and the concentrations of CO2 standard gases is illustrated in Fig. 2 and can be expressed as [CO2 concentration] = 1,404 × [analyzer signal] -583 (r2 = 0.9973). This equation was used by the NDIR CO2 analyzer to precisely calculate the atmospheric CO2 concentration.
3.2 Relationship between CO2 Mass and Turbidity
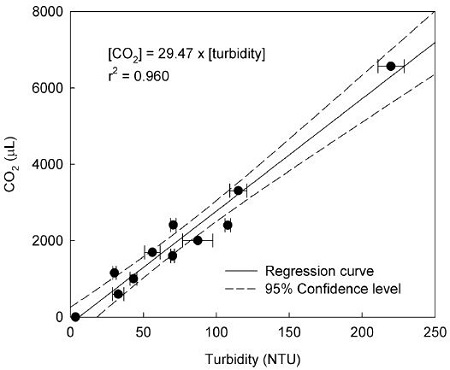
In order to investigate the variation in turbidity caused by the insoluble carbonate salt produced from the reaction of CO2 in the Ba(OH)2 aqueous solution, 2 L of diluted CO2 standard gas, with concentrations ranging from 0 to 3,007ppm, was directly pumped in to the Ba(OH)2 aqueous solution. The relationship between the amount of CO2 and turbidity is illustrated in Fig. 3. Results of the regression analysis show there is a strong correlation (r2 = 0.960) between them. The relationship can be expressed as [CO2 amount] = 29.47 × [turbidity]. Thus, the concentration of atmospheric CO2 could be quantitatively evaluated by the measurement of the change in turbidity in the Ba(OH)2 aqueous solution.
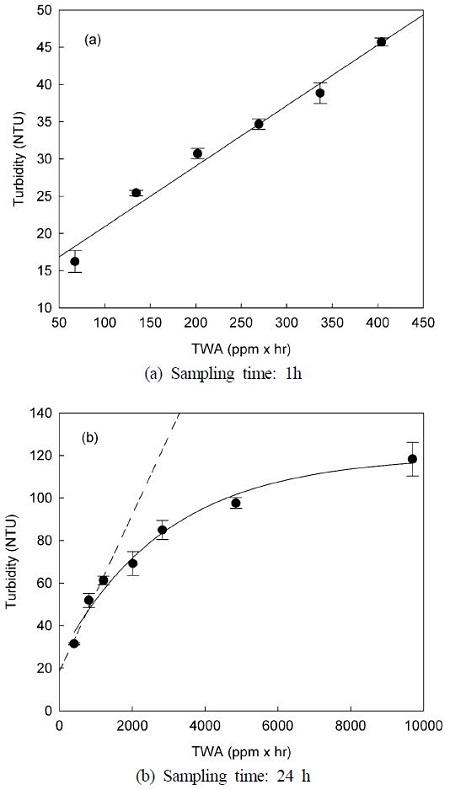
The linearity in the relationship between the variation of turbidity and the time-weighted average (TWA) concentration is important for the accurate evaluation of atmospheric CO2 concentration, because atmospheric CO2 introduced into the passive sampler by molecular diffusion can result in the continuous precipitation of the insoluble salt, (BaCO3), in the Ba-(OH)2 aqueous solution. The relationship between TWA concentration (where mean atmospheric CO2 concentration = 404 ppm) and turbidity, when the sampling times are 1 h and 24 h, is illustrated in Fig. 4. When atmospheric CO2 sampling using passive samplers was carried out for 1 h, TWA concentration was significantly correlated with turbidity (r2 = 0.9794).
However, in the case of 24-h sampling, the linearity between the two variables appeared only at initial TWA concentration (1,200 ppm × h), and the turbidity did not increase linearly with increasing TWA concentration. The turbidity was preferentially formed at the gas-liquid interface and diffused into the Ba(OH)2 aqueous solution during the absorption and reaction of CO2 in the solution. Therefore, it seems likely, that the reaction rate decreases due to the reduction in the gas-liquid interface.
3.3 Sampling Rate
The passive sampler collects the gaseous pollutant from the atmosphere through molecular diffusion. Therefore, the flow rate of air introduced into the passive sampler and the concentration of the pollutant could not be calculated. The concentration of pollutants, which are absorbed into a specific sorbent of the passive sampler, is generally calculated using the sampling rate. The sampling rate of the passive sampler can be calculated as follows:
| (3) |
where SR is the sampling rate (mL min-1), MCO2 is the mass of the CO2 transported by diffusion (μL), Cstd is the concentration of CO2 (ppm), and t is the sampling time (min). Passive and active sampling (i.e., NDIR CO2 analyzer) were performed simultaneously in ambient air to estimate the sampling rate. The exposure experiments, using three identical passive samplers, were carried out for 1 h and 24 h.
The sampling rate (Eq. (3)), calculated from turbidity, CO2 concentration measured by a NDIR CO2 analyzer, and sampling time, is shown in Table 1. The calculated sampling rates for 1 h and 24 h were 42.4±5.4 mL min-1 and 2.3±0.3 mL min-1 with RSDs of 12.7% and 11.5%, respectively. Therefore, the passive sampler with a high sampling rate would be suitable for evaluating the short-term CO2 concentration in the atmosphere.
3.4 Evaluation of Passive Sampler
To evaluate the accuracy of the passive sampler, measurements using the NDIR CO2 analyzer were taken under identical conditions with 1 h sampling time in outdoor and indoor. A comparison of the results of the CO2 concentration measured using the passive sampler and the NDIR CO2 analyzer are shown in Fig. 5. A good correlation was found between data in the comparison experiments. This was represented by a linear relation with determination coefficient (r2) and slope of 0.9471 and 0.964, respectively. At each concentration, the RSDs were 3.5±2.2% (ranging from 0.1 to 7.2%) and were better than the Occupational Safety and Health acceptability criteria of ±25% accuracy (Cassinelli et al., 1987).
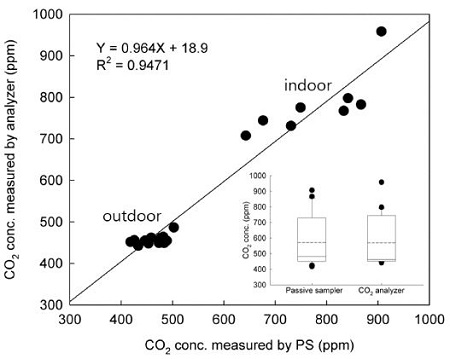
Comparison of results of the CO2 concentration measured by the passive samplers and the NDIR CO2 analyzer. In set: the box plot compares the distribution of CO2 concentration measured by the passive sampler or analyzer.
In order to study the effect of the storage period on the stability of the passive sampler, five sets of exposed and unexposed (blank sample) passive samplers were prepared at the same time and were stored individually under identical conditions (sealed black bags kept at 4℃) for the duration of the experiments. Each set comprised three samplers. The first set of samplers was analyzed immediately after sampling and the remaining four sets of samplers were analyzed after 1, 3, 7, and 14 days. The evaluation of the stability of the passive samplers was performed using statistical tools, such as the analysis of variance (ANOVA) of the linear regression, and the testing of the slope and intercept (Student's t-test). As shown in Eq. (4), if the value calculated from the Student’s t-factor and sb1 is greater than or equal to |b1| and p-value is greater than 0.05 at the 5% significance level, it is believed that the sample would be stable during the storage period (ISO Guide 35, 2006).
| (4) |
where b1 is the slope of straight line, t-factor is the Student’s t-factor, sb1 is the uncertainty of a slope of straight line, and n is the number of sample.
The turbidities measured from the unexposed blank and exposed samples increased from 1.2±0.1 to 15.0±3.1 NTU and from 103.3±4.2 to 113±3.5 NTU, respectively, for the 14-day periods. The results of the regression analysis are shown in Table 2. The p-values calculated for unexposed and exposed samples were 0.15 to 0.18 and 0.71 to 0.78, respectively, and were greater than 0.1. The |b1| values obtained from t-factor and sb1 were also greater than 0.05 at the 5% significance level. Thus, turbidity was observed to be very stable when the passive sampler was stored under cool conditions.

Results of evaluation of the stability as a function of storage period (14-days) for the unexposed (blank) and exposed sample
As shown in Eq. (5) and (6), the detection limit was calculated from the relationship between turbidity and concentration of CO2 standard gas.
| (5) |
| (6) |
where SYX is the standard error for the detection limit of the passive sampler, Yobs is the measured turbidity, Yest is the turbidity obtained from the regression analysis, n is the number of sample, k is 2 (a case of linear regression), A is the analysis sensitivity (i.e., regression slope), and LD is the detection limit.
The results estimated for the passive sampler are shown in Table 3. The detection limit of the passive sampler was 373.2 μL. The detection limits calculated with the 1-h and 24-h sampling rates were 81.5 ppm and 61.5 ppm, respectively, including the blank, for 1-h and 24-h sampling period. Effective sampling with the passive sampler would consider the optimal operating range as a function of the CO2 concentration and the exposure time, considering the estimated blank and detection limit. These results show that this passive sampler would be a good tool for short-term monitoring of atmospheric CO2.
4. CONCLUSIONS
A variety of passive samplers have been developed and used extensively for measuring air pollutants. The fundamental characteristics of the passive sampler are being studied, which could lead to the use of the passive sampler in many monitoring applications. This study evaluated the applicability of the passive sampler in the short-term monitoring of atmospheric CO2. The short-term CO2 passive sampler evaluated in this study appeared to be a good tool for determining atmospheric CO2 levels, and its analytical procedures are simple and quick. The determination of atmospheric CO2 levels using the passive sampler can lead to substantial improvement in atmospheric quality management. Further research is necessary to study the sampling rate under real environmental conditions, such as varying wind speeds and air temperatures, and linearity in the relationship between the sampling time and CO2 concentrations.
References
-
Aikawa, M., Yohikawa, K., Tomida, M., Aotsuka, F., Haraguchi, H., (1995), Continuous monitoring of the carbon dioxide in the urban atmosphere of Nagoya, 1991-1993, Analytical Science, 11, p357-362.
[https://doi.org/10.2116/analsci.11.357]

-
Bertoni, G., Ciuchini, C., Tappa, R., (2004), Measurement of longterm average carbon dioxide concentrations using passive diffusion sampling, Atmospheric Environment, 38, p1625-1630.
[https://doi.org/10.1016/j.atmosenv.2003.12.010]

-
Carmichael, GR., Ferm, M., Thongboonchoo, N., Woo, JH., Chan, LY., Murano, K., Viet, PH., Mossberg, C., Bala, R., Boonjawat, J., Upatum, P., Mohan, M., Adhikary, SP., Shrestha, AB., Pienaar, JJ., Brunke, EB., Chen, T., Jie, T., Guoan, D., Peng, LC., Dhiharto, S., Harjanto, H., Jose, AM., Kimani, W., Kirouane, A., Lacaux, JP., Richard, S., Barturen, O., Cerda, JC., Athayde, A., Tavares, T., Cotrina, JS., Bilici, E., (2003), Measurements of sulfur dioxide, ozone and ammonia concentrations in Asia, Africa, and South America using passive samplers, Atmospheric Environment, 37, p1293-1308.
[https://doi.org/10.1016/S1352-2310(02)01009-9]

- Cassinelli, ME., Hull, RD., Crable, JV., Teass, AW., (1987), Protocol for the evaluation of passive monitors. Diffusive sampling, In Berlin, A., Brown, R.H., Saunders, K.J. (ed), An alternative approach to workplace air monitoring, Royal Society of Chemistry, London, p190-192.
-
Cruz, LPS., Campos, VP., Silva, AMC., Tavares, TM., (2004), A field evaluation of a SO2 passive sampler in tropical industrial and urban air, Atmospheric Environment, 38, p6425-6429.
[https://doi.org/10.1016/j.atmosenv.2004.07.022]

-
George, K., Ziska, LH., Bunce, JA., Quebedeaux, B., (2007), Elevated atmospheric CO2 concentration and temperature across an urban-rural transect, Atmospheric Environment, 41, p7654-7665.
[https://doi.org/10.1016/j.atmosenv.2007.08.018]

-
Gillett, RW., Kreibich, H., Ayers, GP., (2000), Measurement of indoor formaldehyde concentration with a passive sampler, Environmental Science and Technology, 34, p2051-2056.
[https://doi.org/10.1021/es990929n]

-
Gratani, L., Varone, L., (2005), Daily and seasonal variation of CO2 in the city of Rome in relationship with the traffic volume, Atmospheric Environment, 39, p2619-2624.
[https://doi.org/10.1016/j.atmosenv.2005.01.013]

-
Harner, T., Shoeib, M., Diamond, M., Ikonomou, M., Stern, G., (2006), Passive sampler derived air concentrations of PBDEs along an urban-rural transect: Spatial and temporal trends, Chemosphere, 64, p262-267.
[https://doi.org/10.1016/j.chemosphere.2005.12.018]

-
Idso, CD., Idso, SB., Balling, RC. Jr, (2001), An intensive twoweek study of an urban CO2 dome in Phoenix, Arizona, USA, Atmospheric Environment, 35, p995-1000.
[https://doi.org/10.1016/S1352-2310(00)00412-X]

-
Idso, SB., Idso, CD., Balling, RC. Jr, (2002), Seasonal and diurnal variations of near-surface atmospheric CO2 concentration within a residential sector of the urban CO2 dome of Phoenix, AZ, USA, Atmospheric Environment, 36, p1655-1600.
[https://doi.org/10.1016/S1352-2310(02)00159-0]

- ISO Guide 35, (2006), Certification of reference materials - general and statistical principles, 3rd edition, International Organization for Standardization, Geneva.
- IPCC, (2013), Climate change 2013. The physical science basis, in: IPCC Working Group I. Contribution to AR5, Cambridge University Press, Cambridge, UK, p4-29.
-
James, TP., Walter, DK., Thomas, BH., Lee, SW., (1982), Atmospheric carbon dioxide measurements at Barrow, Alaska, 1973-1979, Tellus, 34, p166-175.
[https://doi.org/10.1111/j.2153-3490.1982.tb01804.x]

-
Kirk, WT., Pieter, P., Walter, DK., (1989), Atmospheric carbon dioxide at Mauna Loa Observatory 2, Analysis of the NOAA GMCC data, 1974-1985. Journal of Geophysics Research, 94, p8549-8565.
[https://doi.org/10.1029/JD094iD06p08549]

-
Kousa, A., Monn, C., Rotko, T., Alm, S., Oglesby, L., (2001), Personal exposures to NO2 in the EXPOLIS-study: Relation to residential indoor, outdoor and workplace concentrations in Basel, Helsinki and Prague, Atmospheric Environment, 35, p3405-3412.
[https://doi.org/10.1016/S1352-2310(01)00131-5]

-
Kume, K., Ohura, T., Amagai, T., Fusayaa, M., (2008), Field monitoring of volatile organic compounds using passive air samplers in an industrial city in Japan, Environmental Pollution, 153, p649-657.
[https://doi.org/10.1016/j.envpol.2007.09.023]

- OECD/IEA, (2014), CO2 Emissions from Fuel Combustion, International Energy Agency, 2014 Eds, Paris Cedex, France, p17-30.
-
Rabaud, NE., James, TA., Ashbaugh, LL., Flocchini, RG., (2001), A passive sampler for the determination of airborne ammonia concentrations near large-scale animal facilities, Environmental Science and Technology, 35, p1190-1196.
[https://doi.org/10.1021/es0012624]

-
Reid, KH., Steyn, DG., (1997), Diurnal variations of boundarylayer carbon dioxide in a coastal city-observations and comparison with model results, Atmospheric Environment, 31, p3101-3114.
[https://doi.org/10.1016/S1352-2310(97)00050-2]

-
Stevenson, K., Bush, T., Mooney, D., (2001), Five years nitrogen dioxide measurement with diffusion tube samplers at over 1000 sites in the UK, Atmospheric Environment, 35, p281-287.
[https://doi.org/10.1016/S1352-2310(00)00171-0]

-
Tsai, SW., Hee, SSQ., (2000), A new passive sampler for regulated workplace ketones, AIHAJ - American Industrial Hygiene Association, 61, p808-814.
[https://doi.org/10.1080/15298660008984590]

- UNEP/WHO, (1994), GMES/AIR methodology reviews handbook series Vol. 4: Passive and active sampling methodologies for measurement for air quality, UNEP, Nairobi, p25-38.
