SSPs 기후변화 시나리오에 따른 서양금혼초(Hypochaeris radicata)의 개화 생물계절 및 적합 서식지 분포 예측
 ; An, Nan-Hee**
 ; Eo, Jinu*
 ; Choi, Soon-Kun*
 ; Yeop, So-Jin*
 ; Kim, Myung-Hyun***, †
Abstract
The objective of this study was to predict future changes in flowering phenology and suitable habitat distribution of Hypochaeris radicata. As the climatic environment shifts due to climate change, the phenology and habitat distribution of plants and animals within agricultural ecosystems are also affected. To assess and anticipate the influence of climate change on agricultural ecosystems and to establish adaptive strategies, it is imperative to accurately predict the phenology and habitat distribution of indicator species based on different climate change scenarios. In this context, this study aimed to ascertain the effects of climate change on agricultural ecosystems by predicting changes in the flowering phenology and habitat distribution of H. radicata based on shared socio-economic pathway (SSP) scenarios. Our analysis revealed that the first, maximum, and last flowering dates for H. radicata are expected to shift earlier with climate change, more so under the SSP5-8.5 scenario than the SSP2-4.5 scenario. As climate change raises average temperatures, the growing degree days (GDD) will shorten, leading to earlier blooming periods. Furthermore, the suitable habitat area for H. radicata was 2.09% during the baseline period (1981 ~ 2010). In the SSP2-4.5 scenario, the suitable habitat area rose slightly to 2.28%, 2.51%, and 4.68% for 2011 ~ 2040, 2041 ~ 2070, and 2071 ~ 2100, respectively. Under the SSP5-8.5 scenario, the suitable habitable area for H. radicata was projected to be 2.77%, 13.25%, and 23.61% for the same time periods. Being an alien and agro-ecological indicator species, changes in the flowering phenology and suitable habitat distribution of H. radicata could impact native flora and agriculture in South Korea. It is therefore crucial to persistently monitor and assess the ramifications of these shifts on Korean agricultural ecosystems due to climate change.
Keywords:
Climate Change, Hypochaeris Radicata, Flowering Phenology, Habitat Distribution, SSP Scenario1. 서론
IPCC (Intergovernmental Panel on Climate Change, IPCC)에서는 제6차 평가보고서(AR6)를 통해 2011 ~ 2020년의 전지구 지표면 온도는 1850 ~ 1900년보다 1.1℃ 상승하였으며, 지속되는 온실가스 배출은 지구온난화를 증가시켜 거의 모든 시나리오에서 2021 ~ 2040년에 1.5℃가 상승할 것으로 전망하였다(IPCC, 2023). 기온상승과 같은 기후변화는 생태계의 생물계절(phenoloy) 및 서식지 분포 변화에 영향을 미치며(IPCC, 2014), 생물계절과 서식지 분포는 기후변화에 민감하게 반응하기 때문에 기후변화를 확인하는 중요한 지표로 활용될 수 있다(Andrew et al., 2013; Burton, 2003; Gonzalez et al., 2010; Hickling et al., 2005; Kim, Choi, Cho et al., 2021; Parmesan, 2006; Roy and Sparks, 2000; Walther et al., 2002).
식물의 생물계절은 일반적으로 식물계절(plant phenoloy)이라고 하며 발아, 개엽, 개화, 낙화, 결실 등이 있다. 특히 기후변화로 인한 기온상승에 의해 개엽, 개화와 같은 봄철 현상의 시기가 빨라지고 있다(Badeck et al., 2004). 영국의 385종 식물의 첫 개화시기는 1990년대에 평균 4.5일이 앞당겨졌고 이 중 51종은 15일이 빨라진 것으로 보고되었다(Fitter and Fitter, 2002). 우리나라 7개 식물종(매화, 개나리, 진달래, 복숭아, 배나무, 벚꽃 및 아카시아)의 생물계절 자료(1945 ~ 2007)를 분석한 결과에서도 발아 및 개화시기가 0.7일 ~ 2.7일/10년의 변화율로 빨라지고 있다(Lee et al., 2009). 생물계절에 대한 기후변화 영향 분석 및 미래 예측을 위해서는 기온을 포함한 다양한 기후인자 중 생물계절과 관련이 있는 예측 가능한 인자의 선발이 중요하다. 유효적산온도(growing degree days, GDD)는 동식물의 생물계절 예측에 활용되어 왔으며, 최근에는 기후변화에 따른 생물계절 변화 분석 연구에 빈번하게 활용되고 있다(Bonhomme, 2000; Hodgson et al., 2011; Kim, Choi, Choi, et al., 2021; Nufio et al., 2010).
식물의 서식지 분포는 기후, 토양 지형, 생물 및 인위적 요인 등에 영향을 받으며, 그 중 기온과 강수량은 식물 분포에 중요한 요인으로 작용한다(Hirabayashi et al., 2013; Rosenzweig et al., 2008). 유럽에서 1994년과 50년 후에 유럽호랑가시나무의 분포를 비교한 결과 북상한 것을 확인하였으며, 이러한 분포변화는 식물이 자랄 수 있는 0℃ 등온선의 이동과 관계가 있다고 보고되었다(Walther et al., 2002). 고산식물의 경우 난대성 식물들의 서식지가 고도가 높은 지역으로 확대, 한대성 식물들은 분포지가 쇠퇴하고 있다(Randin et al., 2009; Zimmermann et al., 2013). 이처럼 기후변화는 다양한 종 분포에 영향을 미치고 있으며, 기후변화는 미래 많은 종의 서식지 범위 및 분포를 변화시킬 것으로 예상된다.
종 분포모형(Species Distribution Model)은 생태학 분야에서 종의 서식지 적합성을 예측하는데 활용되고 있다(Elith and Leathwick, 2009). 그 중에서도 MaxEnt모형은 식물의 잠재적 분포를 효과적으로 추정하여 멸종 위기종의 잠재적 분포 및 기후변화에 따른 미래의 종 분포 변화 예측에 사용되고 있다(Booth, 2018; Li et al., 2020; Wilting et al., 2010).
국외에서는 기후변화에 따른 생물이 받는 영향에 대해 다양한 분류군에서 연구가 진행되었으며 이러한 연구를 근거로 생물종 특성에 따른 리스크를 평가하고 적응대책을 수립하고 있다. 우리나라 역시 정책적으로 다양한 분야에서 기후변화 대응에 관한 리스크 평가 및 적응대책을 수립하고 관리하기 위한 체계로 전환하고(KEI, 2014), 기후변화와 관련한 생물의 반응에 관한 연구를 진행하고 있다.
기후변화가 농업생태계에 미치는 영향을 효과적으로 평가하기 위하여 농촌진흥청에서는 농업부문 기후변화 지표종을 선정하였으며, 이 중 식물류는 서양금혼초(Hypochaeris radicata L.), 서양민들레(Taraxacum officinale Weber), 냉이(Capsella bursa-pastoris (L.) L. W. Medicus), 큰개불알풀(Veronica persica Poir.), 광대나물(Lamium amplexicaule L.), 꽃마리(Trigonotis peduncularis (Trevir.) Benth. ex Hemsl) 및 큰망초(Conyza sumatrensis) 등 7종이다.(Kim et al., 2018). 서양금혼초는 국화과 다년생 식물로 유럽의 모로코가 원산지로 알려져 있으며 형태적으로 서양민들레와 유사하고, 길가, 목초지, 잔디밭, 황무지 등에 서식한다. 국내에는 제주도에 많이 분포하고 있으며 최근 조사에 의하면 제주도 전지역과 경남 남해안 및 전남 신안군 등 남서해안 지역에 분포하고 서해안의 강화도, 백령도에서 확인되고 있다(Kim and Lee, 2019). 서양금혼초의 뿌리에서 분비되는 타감물질은 다른 식물의 발생을 억제하기도 하며, 자가 독성도 있다. 아직까지 제주지역의 목초지를 제외하고 서양금혼초가 농경지에 침입은 적은 것으로 판단되나, 향후 한반도에서 잠재 적합 생육지가 증가할 수 있는 식물이다(Park, 2022). 이러한 생태적 중요성에도 불구하고 서양금혼초에 대한 생물계절, 서식지 분포 변화에 대한 연구가 부족하며, 특히 기후변화에 따른 서양금혼초 생물계절 및 서식지 분포를 예측하는 연구가 필요한 실정이다.
본 연구에서는 국내에 유입되어 분포하고 있는 서양금혼초의 생물계절 및 출현지점 자료를 분석하여 기후와의 상관관계를 분석하고, 기후변화 시나리오(SSP)를 적용하여 미래 서양금혼초의 생물계절 및 적합 서식지 분포 변동성을 예측하고자 한다.
2. 재료 및 방법
2.1. 기후변화 시나리오
본 연구에서는 세계기후연구프로그램(World Climate Research Programme, WCRP)의 CIMP6 (Coupled Model Intercomparison Project Phase 6)를 통해 제공되는 전 지구 규모의 SSPs (Shared Sociopeconomic Pathways) 시나리오 자료를 사용하였다(https://esgf-mode.llnl.gov/search/cimp6/). 기후변화 시나리오는 SSP 시나리오 4종(SSP1-2.6, SSP2-4.5, SSP3-7.0, SSP5-8.5) 중 SSP2-4.5와 SSP5-8.5를 사용하였다. Global circulation model (GCM)은 6개 기후변수 자료가 2100년까지 모두 존재하는 11개의 GCM (GFDL-ESM4, MRI-ESM2-0, CNRM-CM6-1, CNRM-ESM2-1, IPSL-CM6A-LR, MPI-ESM1-2-HR, UKESM1-0-LL, ACCESS-CM2, CanESM5, INM-CM4-8, INM-CM5-0)을 선정하여, 3 km 격자의 편의보정된 미래 기간별(근미래: 2011 ~ 2040, 중간미래: 2041 ~ 2070, 먼미래: 2071 ~ 2100) 자료를 활용하였다(Oh et al., 2021).
2.2. 생물계절 조사 및 예측
서양금혼초의 생물계절 자료를 구축하기 위하여 모니터링을 수행하였다. 조사지역은 위도, 연평균기온의 차이, 모니터링 시스템의 설치 가능성, 시스템의 유지 및 관리 용이성 등을 고려하여 해남, 부안, 당진 등 3지점을 선정하였다. 자료조사기간은 당진에서 2017 ~ 2020년, 부안에서 2017 ~ 2019년, 해남에서 2016년 및 2018 ~ 2019년으로 지점별로 일부 차이가 있다. 모니터링은 생물계절 무인관측시스템(Choi et al., 2016)을 이용하였다. 각 지점에 설치한 디지털카메라를 이용하여 야외에서 서양금혼초를 일정한 시간 간격으로 촬영하고, 촬영된 영상을 실시간으로 실험실로 전송하여 서양금혼초의 개화 수를 조사하였다. 무인관측시스템을 이용한 서양금혼초의 개화 수 촬영은 매일 06 ~ 18시에 30분 간격으로 수행하였다.
모니터링 자료를 분석하여 유효적산온도를 바탕으로 서양금혼초의 생물계절 특성을 분석하고 기후변화 시나리오 기반 미래 생물계절 변화를 예측하였다. 생물계절 특성은 지점별 최초(총 개화수의 10% 개화), 최대(50%), 마지막(90%) 개화일을 계산하여 분석하였다. 분석은 R 패키지 “nlstimedist”를 사용하여 수행하였다(Steer et al., 2019). nlstimedist 패키지는 Franco (2018)의 분포함수를 생물계절 자료에 쉽게 적용하기 위하여 만들어졌으며, 비선형회귀를 사용하여 시간 경과에 따라 생물계절 자료를 적합시키는 편리한 방법을 제공한다. nlstimedist에서 누적분포함수(Cumulative distribution function, CDF)와 확률밀도함수(Probability density function, PDF)는 식 (1) 및 (2)와 같이 정의된다.
| (1) |
| (2) |
여기에서 x는 날짜 또는 유효적산온도, r, c, t는 비선형회귀식의 매개변수이다.
미래시나리오에 따른 생물계절 변동 예측을 위해 모든 지점 및 모든 조사기간의 자료를 이용하여 생물계절을 가장 잘 모의하는 모델을 결정하였다. 모델 구성을 위해 기저온도(Tbase)를 0-15℃ 구간에서 1℃ 간격으로 변화시키면서 결정계수가 가장 높을 때의 기저온도를 서양금혼초의 기저온도로 가정하였다. 미래 예측은 결정된 기저온도에 대한 유효적산온도를 이용한 비선형모델을 구축하고, 각 생물계절 현상이 나타나는 시기의 유효적산온도를 미래 시나리오에 적용하여 계산하였다.
2.3. 서식지 분포 조사 및 예측
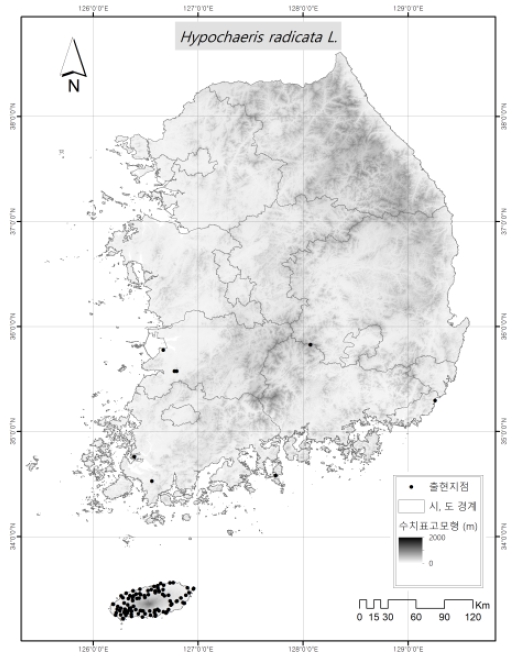
서양금혼초의 출현자료는 2018년에서 2020년까지 우리나라 전국을 대상으로 현장조사를 통하여 수집되었으며, 부족한 자료는 Global Biodiversity Information Facility database (GBIF; https://www.gbif.org/)에서 국내 자료를 수집하였다. Fig. 1은 서양금혼초의 출현지점을 나타내고 있다. 서양금혼초는 총 105지점에서 출현이 확인되었으며, 제주도를 중심으로 전라남·북도 및 경상남도에 산발적으로 분포하는 것으로 나타났다.
본 연구에서는 종분포모델을 개발하기 위해 Table 1과 같이 총 20개의 생물기후변수(bioclimatic variables)를 사용하였다(Kim et al., 2022; Oh et al., 2021). 환경변수의 수는 MaxEnt 모델의 복잡성에 영향을 미치며, 환경변수가 과도하게 많을 경우 종분포 예측의 시간 및 효율성이 떨어질 수 있다. 따라서, 본 연구에서는 percent contribution(퍼센트 기여율)을 기준으로 환경변수를 선택하였으며, 변수들 사이의 상관관계 분석을 통하여 기여도가 높은 변수와 상관성이 높은 변수들을 제외하였다. 환경변수를 일차적으로 선정하기 위하여 MaxEnt를 이용하여 초기모델을 구동하였다. 구체적으로 초기모델의 구동 결과 환경변수의 기여도 백분율을 평가하고, 변수의 기여도가 1 미만인 변수를 제거하였다(Kim et al., 2022). 환경변수가 다중공선성(multicollinearity)을 가진 변수들을 사용하여 모델링을 하면 모델의 결과에 부정적인 영향을 줄 수 있다(Dormann et al., 2013; Heikkinen et al., 2006). 따라서 이러한 변수를 제거하기 위해 초기모델 결과 선정된 변수들에 대하여 피어슨 상관 계수(Pearson’s correlation coefficient, r)를 확인하였다. 만약 변수들 사이에 높은 상관관계(|r|>0.85)가 있는 경우에는 초기모델 결과에서 기여도가 높은 하나의 변수만 선택했다(Oh et al., 2021).
MaxEnt software ver 3.4.4 (Phillips et al., 2021)에서는 6개(L: linear, Q: quadratic, P: product, T: threshold, H: hinge, C: categorical)의 feature class를 제공한다(Elith et al., 2010). MaxEnt에서 분포 모델을 생성할 때는 regularization multiplier (default value - 1)를 사용하여 분포를 예측하며, regularizatioin multiplier는 모델링에 사용된 feature class의 강도를 제어하여 모델의 복잡성 또는 과대적합을 방지할 수 있다. MaxEnt를 이용하여 최적의 모델을 만들기 위해서는 여러 개의 다른 features combination과 regularization multiplier의 model setting을 통해 최적의 모델을 선택할 필요가 있다(Elith et al., 2010; Kim et al., 2022; Morales et al., 2017; Oh et al., 2021).
본 연구에서는 6개의 feature combination (L, LQ, H, LQH, LQHP, LQHPT)과 8개의 regularization parameters (0.5, 1, 1.5, 2, 2.5, 3, 3.5, 4)로 총 48개의 모델을 만들었다. 최적 모델은 AICc값이 작은 모델을 선택하였으며, jackknife test와 10-fold cross-validation을 통하여 평균 AUC와 각 변수의 중요성을 평가하였다. AUC값의 범위는 0.5에서 1사이이며, 값이 클수록 모형의 예측이 향상된다. 모델 예측 정확도는 AUC 값에 따라 5등급으로 구분될 수 있다: 0.5-0.6, fail; 0.6-0.7, poor; 0.7-0.8, fair; 0.8-0.9, good; 0.9-1.0, excellent (Kim et al., 2022; Swets, 1988).
선택된 모델을 사용하여 SSP 시나리오의 기준년도(1981 ~ 2010) 기후조건과 SSP2 4.5와 SSP5 8.5 시나리오에 따른 미래 기후조건(2011 ~ 2040, 2041 ~ 2070, 2071 ~ 2100)에서 서양금혼초의 분포를 지도화하였다. MaxEnt 모델링의 결과는 서양금혼초의 서식 적합성을 0에서 1사이로 표시한 것으로 서식지의 분포변화를 확인하기 위해 적합성을 동일한 간격 접근법(equal interval approach)을 사용하여 5등급으로 구분하였다: 0-0.2 (non-suitable area), 0.2-0.4 (low-suitability area), 0.4-0.6 (general-suitability area), 0.6-0.8 (medium-suitability area), 0.8-1 (high-suitability area) (Li et al., 2020; Oh et al., 2021).
3. 결과 및 고찰
3.1. 생물계절
서양금혼초의 생물계절 모니터링 자료 분석 결과, 최초 개화시기는 해남에서 2018년에 128.3일로 가장 빨랐고, 부안에서 2018년에 184일로 가장 늦은 것으로 나타났다. 최대 개화시기도 최초 개화시기와 동일하게 해남에서 2018년에 148.2일로 가장 빨랐고, 부안에서 2018년에 212.6일로 가장 늦은 것으로 나타났다. 마지막 개화시기는 해남에서 2018년에 169.5일로 가장 빨랐고, 부안에서 2017년에 296.2일로 가장 늦은 것으로 나타났다. 개화기간은 당진에서 2020년에 23.9일로 가장 짧았고, 부안에서 2017년에 156.0일로 가장 긴 것으로 나타났다.
평균 최초 개화시기는 당진, 부안, 해남에서 각각 153.7일, 153.5일 및 135.1일로 해남에서 가장 개화가 빠른 것으로 나타났고, 당진과 부안은 큰 차이를 보이지 않았다. 평균 최대 개화시기는 당진, 부안, 해남에서 각각 161.5일, 193.8일, 157.3일로, 해남에서 가장 빠르고 부안에서 가장 느린 것으로 분석되었다. 마지막 개화시기 또한 당진, 부안, 해남에서 각각 215.6일, 262.7일, 181.9일로 해남에서 가장 빠르고 부안에서 가장 느린 것으로 나타났다. 개화시기는 토양, 유전, 질병, 기후 등 다양한 환경 요인에 영향을 받지만 주로 기온의 영향을 많이 받는 것으로 알려져 있으며(Fitter et al., 1995; Lechowicz, 1995; Park et al., 2023; Sparks et al., 2000; Walkovszky, 1998), 따라서 평균기온이 높은 해남에서 최초, 최대 및 최종 개화시기가 가장 빠른 것으로 나타났다. Table 2는 지점 및 연도별 서양금혼초의 최초, 최대, 마지막 개화시기 및 개화기간을 나타내고 있고, Fig. 2는 지점 및 연도별 서양금혼초 개화일수의 CDF 및 PDF를 나타내고 있다. Fig. 2에서는 지점별, 연도별 개화일수 분포의 차이를 확인할 수 있다. CDF에서는 기온이 높은 해남의 개화수가 빠르게 증가하는 것을 확인할 수 있으며, PDF에서는 마찬가지로 기온이 높은 해남의 피크가 다른 지역에 비해 빠르게 형성되는 것을 확인할 수 있다. 또한 연도별로 기온의 차이에 따른 개화패턴의 차이를 확인할 수 있다.
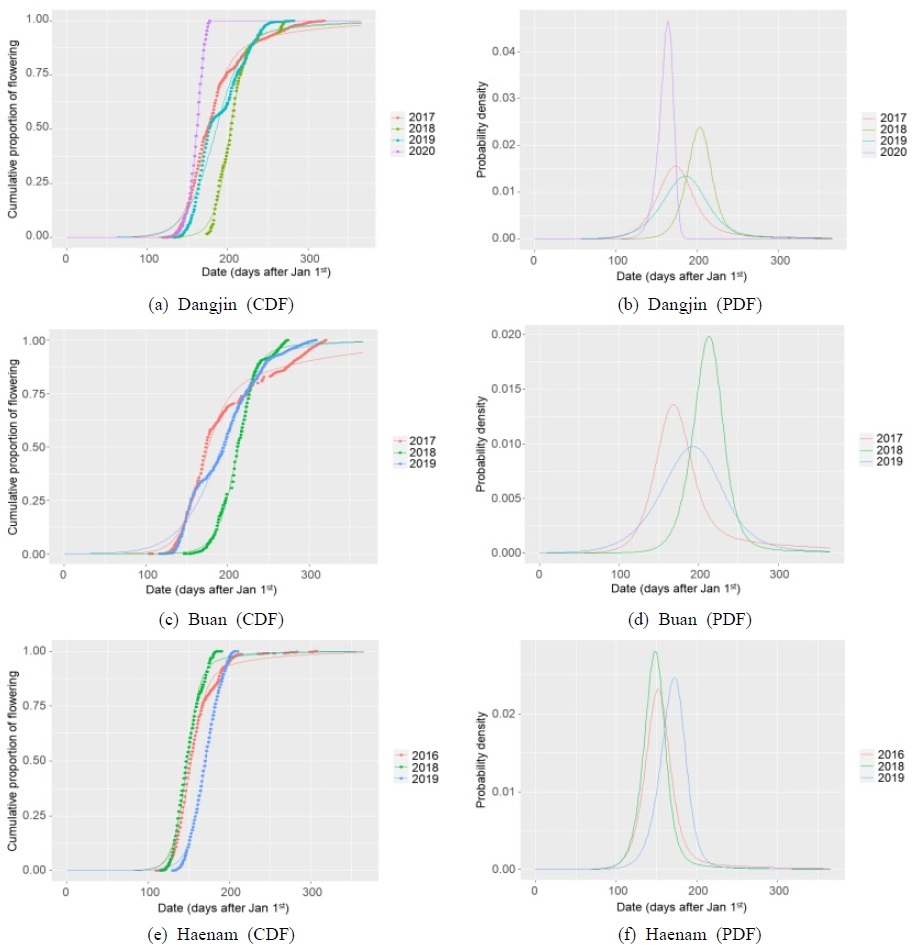
Cumulative density functions (CDF: a, c, and e) and probability density functions (PDF: b, d, and f) of Hypochaeris radicata in South Korea
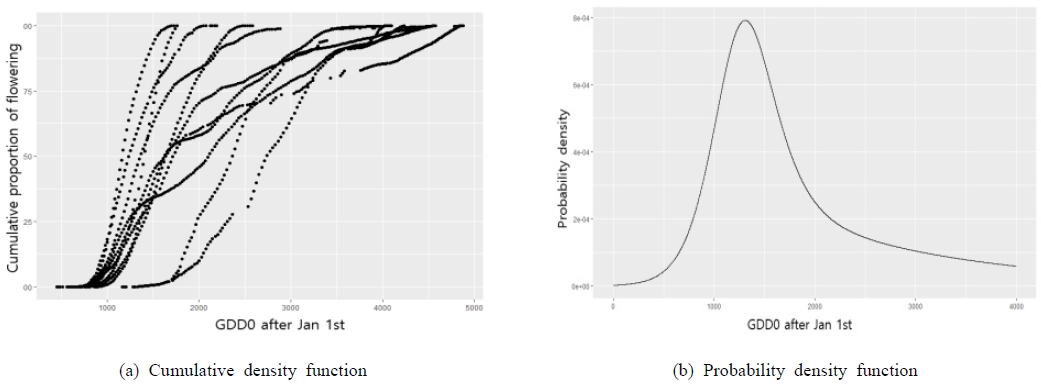
지역과 연도를 통합하여 유효적산온도에 따른 서양금혼초의 개화 생물계절의 변화를 파악하였다. 기저온도(Tbase)를 0-15℃ 구간에서 1℃ 간격으로 변화시키면서 결정계수가 가장 높을 때의 기저온도를 산정한 결과, 서양금혼초의 개화 생물계절을 가장 잘 설명하는 기저온도는 0℃(R2=0.783)로 분석되었다. 서양금혼초는 GDD0(기저온도를 0℃로 설정한 유효적산온도)이 990.5℃day에서 최초로 개화를 하고, 1,572.1℃day에서 50% 개화, 4,030.1℃day에서 마지막 개화를 하는 것으로 나타났다. Fig. 3은 GDD0에 대한 지역과 연도를 통합한 자료의 CDF와 PDF를 나타내고 있다.
모니터링 자료를 바탕으로 산정한 서양금혼초의 개화시기별 GDD0값을 활용하여 SSP 시나리오에 따른 미래 서양금혼초의 생물계절 변화를 모의하였다. 시나리오, 지역에 상관없이 시간의 경과에 따라 서양금혼초의 최초, 최대 및 마지막 개화시기는 모두 빨라지고, 개화기간은 짧아지는 경향을 나타냈다. 당진의 경우 서양금혼초의 마지막 개화시기에 필요한 GDD0을 많은 시나리오에서 충족하지 못하는 것으로 나타났다. 따라서 모델링 결과는 부안과 해남에 대해서만 제시하였다. Table 3은 지역별 서양금혼초의 기준년도 및 미래 기간별 최초, 최대, 마지막 개화시기 및 개화기간을 나타내고 있다.
부안에서 기준년도(1981 ~ 2010) 최초, 최대 및 최종 개화시기는 각각 142일, 171일, 272일로 나타났다. 미래 기간 최초 개화시기는 SSP2-4.5 시나리오에서 2011 ~ 2040, 2041 ~ 2070, 2071 ~ 2100에 대하여 각각 134일, 127일, 121일로 먼 미래로 갈수록 개화시기가 빨라지는 것으로 나타났다. SSP5-8.5 시나리오에서는 2011 ~ 2040, 2041 ~ 2070, 2071 ~ 2100에 대하여 각각 134일, 122일, 106일로 먼 미래로 갈수록 SSP2-4.5에 비하여 개화시기가 더욱 빨라지는 것으로 나타났다. 미래기간 최대 개화시기는 SSP2-4.5 및 SSP5-8.5 시나리오에 대하여 미래기간(2011 ~ 2040, 2041 ~ 2070, 2071 ~ 2100)에 각각 163일, 155일, 149일 및 162일, 150일, 134일로 나타났다. 또한, 미래기간 최종 개화시기는 SSP2-4.5 및 SSP5-8.5 시나리오에 대하여 미래기간(2011 ~ 2040, 2041 ~ 2070, 2071 ~ 2100)에 각각 256일, 245일, 237일 및 255일, 238일, 220일로 나타났다. Fig. 4는 부안지역의 기간별 최초, 최대, 마지막 개화시기 및 개화기간 모의 결과를 박스플롯으로 나타내고 있다. 그래프를 통해 미래 개화시기가 전반적으로 빨라지고 있으며, SSP5-8.5 시나리오에서 개화시기가 특히 빨라지는 것을 확인할 수 있다.
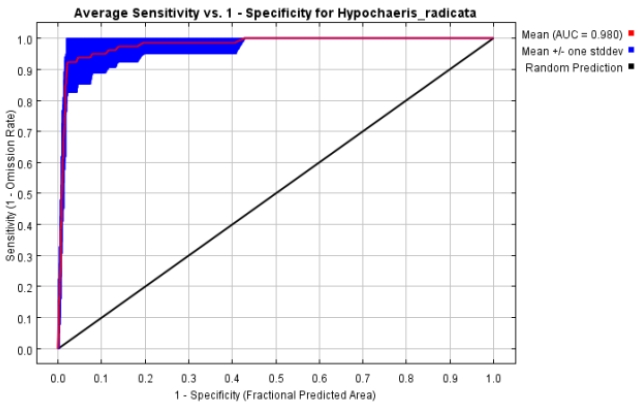
The ROC (Receiver Operating Characteristic) curve and AUC (Area Under ROC Curve) values by the MaxEnt model for Hypochaeris radicata
해남에서 기준년도(1981 ~ 2010) 기간에 최초, 최대 및 최종 개화시기는 각각 137일, 167일, 268일로 나타났다. 미래 기간 최초 개화시기는 SSP2-4.5 시나리오에서 2011 ~ 2040, 2041 ~ 2070, 2071 ~ 2100에 대하여 각각 129일, 121일, 114일로 먼 미래로 갈수록 개화시기가 빨라지는 것으로 나타났다. SSP5-8.5 시나리오에서는 2011 ~ 2040, 2041 ~ 2070, 2071 ~ 2100에 대하여 각각 129일, 115일, 99일로 먼 미래로 갈수록 SSP2-4.5에 비하여 개화시기가 앞당겨지는 것으로 분석되었다. 미래기간 최대 개화시기는 SSP2-4.5 및 SSP5-8.5 시나리오에 대하여 미래기간(2011 ~ 2040, 2041 ~ 2070, 2071 ~ 2100)에 각각 158일, 150일, 144일 및 158일, 144일, 128일로 나타났다. 또한, 미래기간 최종 개화시기는 SSP2-4.5 및 SSP5-8.5 시나리오에 대하여 미래기간(2011 ~ 2040, 2041 ~ 2070, 2071 ~ 2100)에 각각 252일, 241일, 232일 및 251일, 233일, 215일로 나타났다.
최대 및 최종 개화시기 또한 최초 개화시기와 마찬가지로 과거에 비해 미래 기간으로 갈수록 빨라지는 것으로 분석되었으며, SSP2-4.5 시나리오에 비해 SSP5-8.5 시나리오에서 개화시기가 빨라지는 것으로 나타났다. 미래기간으로 갈수록 개화시기가 빨라지는 것은 기후변화로 인해 미래기간에 평균기온이 상승함에 따라 유효적산온도를 충족하는 기간이 짧아지기 때문으로 판단된다. 또한, SSP5-8.5 시나리오에서 SSP2-4.5 시나리오에 비해 개화시기가 빠른 것은 SSP5-8.5의 경우 무분별한 개발로 복사강제력 및 기온이 미래기간에 비교적 크게 증가하기 때문으로 판단되며, 국내 다양한 선행연구에서도 비슷한 결과가 도출된 바 있다(Choi et al., 2016; Kim, Choi, Cho, et al., 2021; Park et al., 2023). 식물의 생물계절 변화는 식물 군집관계 및 생태계 생물의 상호작용에 다양한 영향을 미칠 수 있다(Chen, 2011; Fitter et al., 1995; Miller-Rushing and Primack, 2008; Park et al., 2023).
3.2. 서식지 분포
초기 모델링 및 변수간 상관관계 분석 결과를 바탕으로 최저강수분기의 평균기온(bio09), 최저강수월의 강수량(bio14), 최온난분기의 강수량(bio18) 및 최한랭분기의 강수량(bio19)이 모델 구동을 위한 환경변수로 선정되었다(Table 4). 최적 모델은 LQH_3.0로 선정되었으며, 평균 test AUC는 Fig. 4와 같이 0.980으로 계산되었다. 본 연구에서 구축한 모델은 AUC 값이 0.9 이상(excellent)으로 모델을 신뢰할 수 있고 적합한 성능을 가진 모델로 판단된다(Swets, 1988).
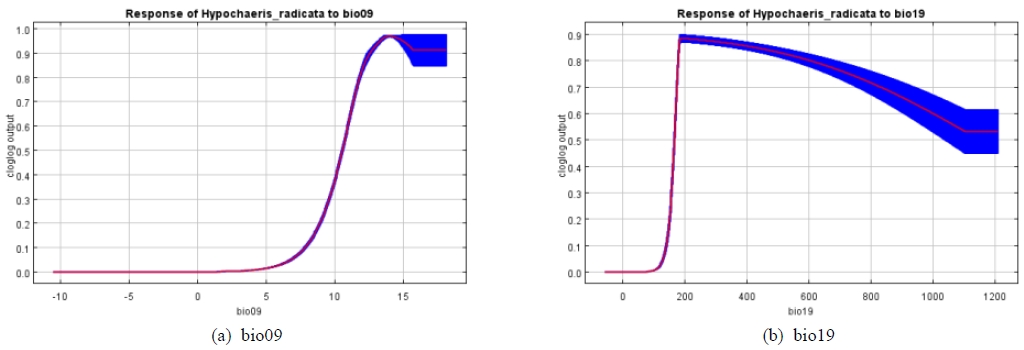
종분포모델 구동을 위하여 선정된 변수들의 기여도는 Table 4와 같다. 환경변수 중 bio09가 67.7%로 가장 높은 기여도를 나타냈고, 다음으로 bio19, bio14 및 bio18이 각각 27.4%, 3.4% 및 1.4%의 기여도를 나타냈다. Jacknife test 결과에서도 bio09, bio19, bio14가 중요한 환경변수로 확인되었다(Fig. 5) 환경 변수중 서양민들레의 분포에 높은 기여도(10%)를 나타내는 bio09와 bio19의 반응곡선을을 확인한 결과, bio09의 반응곡선은 5℃부터 값이 급격히 증가하면서 12℃ 이상에서 최고의 값을 나타냈으며, bio19는 약 180 mm에서 최댓값을 나타낸 후 점진적으로 감소하는 것으로 나타났다(Fig. 6).
Table 5는 서양금혼초의 기준년도 및 미래기간별 SSP 시나리오에 따른 적합 서식지 면적을 나타내고 있으며, Fig. 7은 기간별 우리나라 적합 서식지 분포를 표시하고 있다. 기준년도(1981 ~ 2010)의 서식지 분포 모의 결과, 제주도를 중심으로 남해안 일부에 서양금혼초가 서식하는 것으로 나타나 모니터링 결과와 큰 차이를 보이지 않았다. 최고(high) 적합지는 기준년도(1981 ~ 2010)에 우리나라 전체 면적의 1.01%를 차지했으며, SSP2-4.5 시나리오에서 2011 ~ 2040, 2041 ~ 2070 및 2071 ~ 2100에 각각 0.81%, 0.83% 및 0.81%로 소폭 감소되었다. SSP5-8.5 시나리오에서는 2011 ~ 2040, 2041 ~ 2070 및 2071 ~ 2100에 각각 0.93%, 0.72% 및 0.62%로 SSP2-4.5와 마찬가지로 소폭 감소하는 것으로 나타났다. 중간(Medium) 적합지는 기준년도에 0.65%로 나타났으며, SSP2-4.5 및 SSP5-8.5 시나리오에서 미래기간 2011 ~ 2040, 2041 ~ 2070, 2071 ~ 2100에 각각 0.64%, 0.71%, 0.71% 및 0.58%, 0.68%, 2.26%로 나타났다. 중간적합지의 경우 SSP2-4.5 시나리오에서는 미래기간에 소폭 증가하는 것으로 나타났으나, SSP5-8.5 시나리오에서 2071 ~ 2100 기간에 3배 이상 크게 증가하는 것으로 모의되었다.

Changes of suitable area ratio for Hypochaeris radicata under climate change using SSP2-4.5 and SSP5-8.5 in South Korea
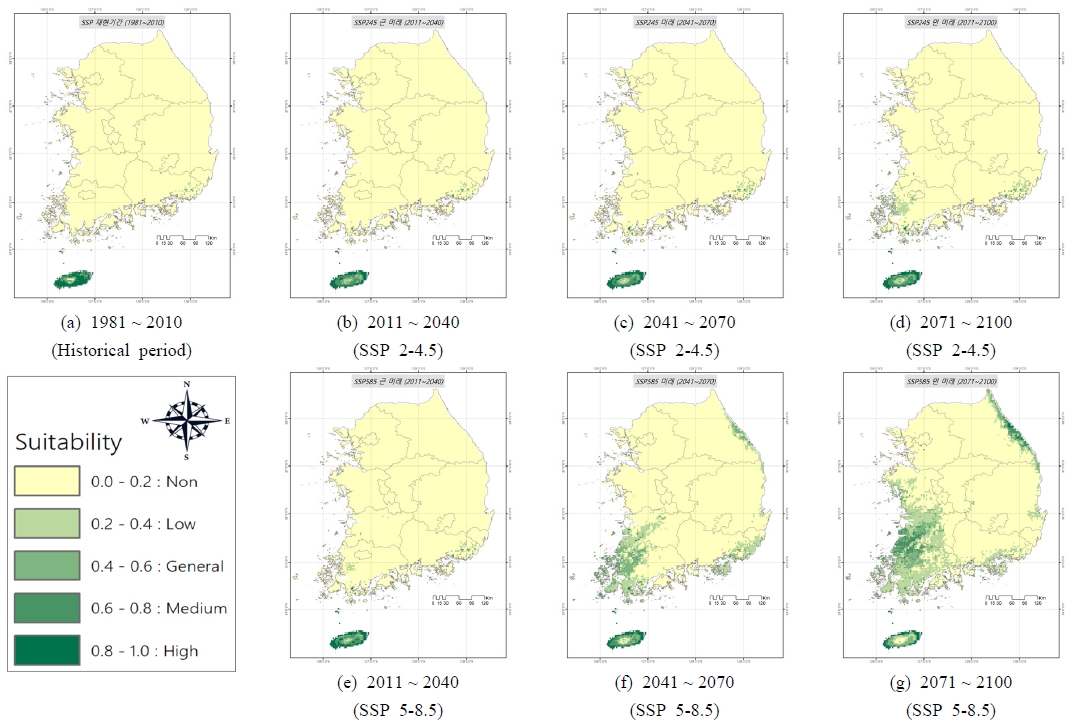
Potential distribution of suitable area of Hypochaeris radicata under climate change using SSP2-4.5 and SSP5-8.5 in South Korea
일반(General) 적합지는 기준년도에 0.21%로 나타났으며, SSP2-4.5 및 SSP5-8.5 시나리오에서 미래기간 2011 ~ 2040, 2041 ~ 2070, 2071 ~ 2100에 각각 0.48%, 0.45%, 0.51% 및 0.55%, 3.84%, 5.09%로 나타났다. 일반적합지는 중간적합지와 마찬가지로 SSP2-4.5 시나리오에서는 미래기간에 소폭 증가하는 것으로 나타났다. 하지만 SSP5-8.5 시나리오에서 2041 ~ 2070 및 2071 ~ 2100 기간에 크게 증가하는 것으로 모의되었다. 낮은(Low) 적합지는 기준년도에 0.22%로 나타났으며, SSP2-4.5 및 SSP5-8.5 시나리오에서 미래기간 2011 ~ 2040, 2041 ~ 2070, 2071 ~ 2100에 각각 0.34%, 0.52%, 2.62% 및 0.71%, 8.02%, 15.64%로 나타났다. 낮은적합지는 SSP2-4.5 시나리오에서는 미래기간에 점진적으로 증가하다가 2071-2100에 2.64%로 10배 이상 증가하는 것으로 나타났다. SSP5-8.5 시나리오의 경우 2041 ~ 2070 및 2071 ~ 2100 기간에 8.02% 및 15.64%로 먼 미래에 서양금혼초의 서식가능 지역이 크게 증가하는 것으로 모의되었다.
최고, 중간, 일반 및 낮은 적합지를 모두 합친 서식가능 면적은 기준년도에 2.09%로 나타났으며, SSP2-4.5 시나리오에서 미래기간 2011 ~ 2040, 2041 ~ 2070, 2071 ~ 2100에 각각 2.28%, 2.51%, 4.68%로 소폭 증가하는 것으로 분석되었다. SSP5-8.5 시나리오에서는 미래기간 2011 ~ 2040, 2041 ~ 2070, 2071 ~ 2100에 각각 2.77%, 13.25%, 23.61%로 미래기간으로 갈수록 서식가능 지역이 대폭 증가해 먼 미래에는 국토 면적의 약 4분의 1에서 서양금혼초가 서식할 수 있는 것으로 나타났다. 서양금혼초의 미래 서식지역은 제주도, 전라도의 넓은 지역과 강원도 및 경상도 해안가 일부 지역으로 나타났다.
서양금혼초는 1980년대 제주도를 중심으로 서식하기 시작한 외래종으로(Kim and Kil, 2016; Park, 2022), 미래 기간에 우리나라에서 서식지 분포가 증가할 것으로 예상하고 있다(Adhikari et al., 2019; Park, 2022). 서양금혼초와 같은 외래종의 빠른 확산은 우리나라 자생 식물의 서식지 분포에 영향을 줄 수 있으며, 우리나라 생태계의 생물다양성을 감소시킬 수 있다(Adhikari et al., 2019; Bradley et al., 2010; Oh et al., 2021; Park, 2022; Vilà et al., 2011). 또한 서양금혼초는 기후변화 농업생태 지표종으로, 서양금혼초의 서식지 변화가 우리나라 농업에 미치는 영향을 지속적으로 관찰하고 분석할 필요가 있을 것으로 사료된다(Nam et al., 2018).
4. 결론
본 연구에서는 기후변화가 농업생태계에 미치는 영향을 파악하기 위해 농업생태 기후변화 지표생물인 서양금혼초를 대상으로 SSP 시나리오 기반 미래 생물계절 및 서식지 분포 변화를 예측 및 분석하였다. 미래 생물계절 변화는 모니터링 자료를 바탕으로 유효적산온도를 통해 예측하였으며, 미래 적합 서식지 분포 변화는 MaxEnt 모델을 적용하여 예측하였다.
서양금혼초의 최초, 최대 및 최종 개화시기는 과거에 비해 미래 기간으로 갈수록 빨라지는 것으로 분석되었으며, SSP2-4.5 시나리오에 비해 SSP5-8.5 시나리오에서 개화시기가 더욱 앞당겨지는 것으로 나타났다. 미래기간으로 갈수록 개화시기가 빨라지는 것은 기후변화로 인해 미래기간에 평균기온이 상승함에 따라 유효적산온도를 충족하는 기간이 짧아지기 때문이며, SSP5-8.5 시나리오에서 SSP2-4.5 시나리오에 비해 개화시기가 빠른 것은 SSP5-8.5의 경우 기온이 미래기간에 비교적 크게 증가하기 때문이다.
서양금혼초의 적합 서식지 면적은 기준년도에 2.09%로 나타났으며, SSP2-4.5 시나리오에서 미래기간 2011 ~ 2040, 2041 ~ 2070, 2071 ~ 2100에 각각 2.28%, 2.51%, 4.68%로 소폭 증가하는 것으로 분석되었다. SSP5-8.5 시나리오에서는 미래기간 2011 ~ 2040, 2041 ~ 2070, 2071 ~ 2100에 각각 2.77%, 13.25%, 23.61%로 미래기간으로 갈수록 서식가능 지역이 대폭 증가해 먼 미래에는 국토 면적의 약 4분의 1에서 서양금혼초가 서식할 수 있는 것으로 나타났다.
서양금혼초는 외래종이자 농업생태 기후변화 지표종으로, 서양금혼초의 생물계절 및 서식지 분포 변화는 우리나라 자생식물 및 농업에 영향을 미칠 수 있다. 따라서 기후변화에 따른 서양금혼초의 생물계절 및 서식지 변화가 우리나라 생태계 및 농업에 미치는 영향을 지속적으로 관찰하고 분석할 필요가 있을 것으로 사료된다.
기후변화로 인해 농업생태계에 서식하는 생물들의 출현시기 및 기간 등 생태계적 특성이 변하고 있다. 향후 기후변화가 농업생태계에 미치는 영향을 분석하기 위해서는 다양한 지표생물에 관한 생물계절 및 서식지 분포 등 미래 출현특성 변화에 관한 연구가 지속적으로 수행될 필요가 있다. 본 연구는 향후 기후변화의 농업생태계에 대한 영향 분석을 위한 기초자료로 활용될 수 있을 것으로 기대된다.
Acknowledgments
본 연구는 농촌진흥청 고유연구사업 ‘기후영향 지표생물·물환경 변동 실태조사 및 환경생태 빅데이터 분석(PJ016740)’의 지원에 의해 이루어진 것임.
References
-
Adhikari P, Jeon JY, Kim HW, Shin MS, Adhikari P, Seo C. 2019. Potential impact of climate change on plant invasion in the Republic of Korea. J Ecol Environ 43: 36.
[https://doi.org/10.1186/s41610-019-0134-3]

-
Andrew NR, Hill SJ, Binns M, Bahar MH, Ridley EV, Jung MP, Fyfe C, Yates M, Khusro M. 2013. Assessing insect responses to climate change: What are we testing for? Where should we be heading? PeerJ 1: e11.
[https://doi.org/10.7717/peerj.11]

-
Badeck FW, Bondeau A, Böttcher K, Doktor D, Lucht W, Schaber J, Sitch S. 2004. Responses of spring phenology to climate change. New Phytol 162(2): 295-309.
[https://doi.org/10.1111/j.1469-8137.2004.01059.x]

-
Bonhomme R. 2000. Bases and limits to using ‘degree.day’ units. Eur J Agron 13(1): 1-10.
[https://doi.org/10.1016/S1161-0301(00)00058-7]

-
Booth TH. 2018. Species distribution modelling tools and databases to assist managing forests under climate change. For Ecol Manag 430: 196-203.
[https://doi.org/10.1016/j.foreco.2018.08.019]

-
Bradley BA, Wilcove DS, Oppenheimer M. 2010. Climate change increases risk of plant invasion in the Eastern United States. Biol Invasions 12(6): 1855-1872.
[https://doi.org/10.1007/s10530-009-9597-y]

- Burton JF. 2003. The apparent influence of climatic change on recent changes of range by European insects (Lepidoptera, Orthoptera). Proceedings of the 13th International Colloquium of the European Invertebrate Survey; 2001 Sep 2~Sep 5; The National Museum of National History (Naturalis). Leiden, The Netherlands: European Invertebrate Survey-Netherlands. p. 13-21.
-
Chen IC, Hill JK, Ohlemüller R, Roy DB, Thomas CD. 2011. Rapid range shifts of species associated with high levels of climate warming. Science 333(6045): 1024-1026.
[https://doi.org/10.1126/science.1206432]

-
Choi SK, Kim MH, Choi LJ, Eo J, Bang HS. 2016. Prediction of the flight times of Hydrochara affinis and Sternolophus rufipes in paddy fields based on RCP 8.5 scenario. Korean J Agric For Meteorol 18(1): 16-29 (in Korean with English abstract).
[https://doi.org/10.5532/KJAFM.2016.18.1.16]

-
Dormann CF, Elith J, Bacher S, Buchmann C, Carl G, Carré G, Marquez JRG, Gruber B, Lafourcade B, Leitão PJ, Münkemüller T, McClean C, Osborne PE, Reineking B, Schröder B, Skidmore AK, Zurell D, Lautenbach S. 2013. Collinearity: A review of methods to deal with it and a simulation study evaluating their performance. Ecography 36(1): 27-46.
[https://doi.org/10.1111/j.1600-0587.2012.07348.x]

-
Elith J, Kearney M, Phillips S. 2010. The art of modelling range-shifting species. Methods Ecol Evol 1(4): 330-342.
[https://doi.org/10.1111/j.2041-210X.2010.00036.x]

-
Elith J, Leathwick JR. 2009. Species distribution models: Ecological explanation and prediction across space and time. Annu Rev Ecol Evol Syst 40: 677-697.
[https://doi.org/10.1146/annurev.ecolsys.110308.120159]

-
Fitter AH, Fitter RSR, Harris ITB, Williamson MH. 1995. Relationships between first flowering date and temperature in the flora of a locality in central England. Funct Ecol 9(1): 55-60.
[https://doi.org/10.2307/2390090]

-
Fitter AH, Fitter RSR. 2002. Rapid changes in flowering time in British plants. Science 296(5573): 1689-1691.
[https://doi.org/10.1126/science.1071617]

-
Franco M. 2018. The time distribution of biological phenomena - Illustrated with the London marathon. PeerJ Prepr 6: e27175v1.
[https://doi.org/10.7287/peerj.preprints.27175v1]

-
Gonzalez P, Neilson RP, Lenihan JM, Drapek RJ. 2010. Global patterns in the vulnerability of ecosystems to vegetation shifts due to climate change. Glob Ecol Biogeogr 19(6): 755-768.
[https://doi.org/10.1111/j.1466-8238.2010.00558.x]

-
Heikkinen RK, Luoto M, Araújo MB, Virkkala R, Thuiller W, Sykes MT. 2006. Methods and uncertainties in bioclimatic envelope modelling under climate change. Prog Phys Geogr 30(6): 751-777.
[https://doi.org/10.1177/0309133306071957]

-
Hickling R, Roy DB, Hill JK, Thomas CD. 2005. A northward shift of range margins in British Odonata. Glob Chang Biol 11(3): 502-506.
[https://doi.org/10.1111/j.1365-2486.2005.00904.x]

-
Hirabayashi Y, Mahendran R, Koirala S, Konoshima L, Yamazaki D, Watanabe S, Kim H, Kanae S. 2013. Global flood risk under climate change. Nat Clim Chang 3: 816-821.
[https://doi.org/10.1038/nclimate1911]

-
Hodgson JA, Thomas CD, Oliver TH, Anderson BJ, Brereton TM, Crone EE. 2011. Predicting insect phenology across space and time. Glob Chang Biol 17(3): 1289-1300.
[https://doi.org/10.1111/j.1365-2486.2010.02308.x]

- IPCC (Intergovernmental Panel on Climate Change). 2014. Climate change 2014: Synthesis report. Contribution of working groups I, II and III to the fifth assessment report of the Intergovernmental Panel on Climate Change. Geneva, Switzerland: IPCC.
- IPCC (Intergovernmental Panel on Climate Change). 2023. Summary for policymakers. In: Core Writing Team, Lee H, Romero J (eds). Climate Change 2023: Synthesis report. Contribution of working groups I, II and III to the sixth assessment report of the Intergovernmental Panel on Climate Change. Geneva, Switzerland: IPCC. p. 1-34.
- KEI (Korea Environment Institute). 2014. Prospect for climate environment risk and national strategy. Sejong, Korea: Author.
-
Kim CG, Kil J. 2016. Alien flora of the Korean peninsula. Biol Invasions 18(7): 1843-1852.
[https://doi.org/10.1007/s10530-016-1124-3]

-
Kim JW, Lee IY. 2019. Germination characteristics of Cat’s Ear (Hypochaeris radicata). Weed Turf Sci 8(2): 179-183 (in Korean with English abstract).
[https://doi.org/10.5660/WTS.2019.8.2.179]

-
Kim MH, Choi SK, Cho J, Kim MK, Eo J, Yeop SJ, Bang JH. 2022. Predicting the suitable habitat distribution of Conyza sumatrensis under RCP scenarios. Korean J Environ Biol 40(1): 1-10 (in Korean with English abstract).
[https://doi.org/10.11626/KJEB.2022.40.1.001]

- Kim MH, Choi SK, Cho JP, Kim MK, Eo J, Bang JH, Seong JM. 2021. Report on the climate change impact and vulnerability assessment on agricultural environment and ecology. Phase I(2016-2020). Wanju, Korea: National Institute of Agricultural Sciences.
-
Kim MH, Choi SK, Choi SW, Jung, C, Oh YJ, Kim MK, Eo J, Yeob SJ, Bang JH. 2021. Selection of 30 indicator species for climate change in agroecosystem using Analytical Hierarchy Process (AHP) and expert questionnaire survey. J Clim Chang Res 12(5-1): 421-429 (in Korean with English abstract).
[https://doi.org/10.15531/ksccr.2021.12.5.421]

- Kim MH, Choi SK, Jung YC, Ahn KJ, Oh YJ, Song YJ, Kown SI, Nam HK. 2018. Indicator species of climate change in agroecosystem of Korea. Wanju, Korea: National Institute of agricultural Sciences.
-
Lechowicz MJ. 1995. Seasonality of flowering and fruiting in temperate forest trees. Can J Bot 73(2): 175-182.
[https://doi.org/10.1139/b95-021]

- Lee KM, Kown WT, Lee SH. 2009. A study on plant phenological trends in South Korea. J Korean Assoc Reg Geogr 15(3): 337-350 (in Korean with English abstract).
-
Li J, Fan G, He Y. 2020. Predicting the current and future distribution of three Coptis herbs in China under climate change conditions, using the MaxEnt model and chemical analysis. Sci Total Environ 698: 134141.
[https://doi.org/10.1016/j.scitotenv.2019.134141]

-
Miller-Rushing AJ, Primack RB. 2008. Global warming and flowering times in Thoreau’s Concord: A community perspective. Ecology 89(2): 332-341.
[https://doi.org/10.1890/07-0068.1]

-
Morales NS, Fernández IC, Baca-González V. 2017. MaxEnt’s parameter configuration and small samples: Are we paying attention to recommendations? A systematic review. PeerJ 5: e3093.
[https://doi.org/10.7717/peerj.3093]

-
Nam HK, Song YJ, Kwon SI, Eo J, Kim MH. 2018. Potential changes in the distribution of seven agricultural indicator plant species in response to climate change at agroecosystem in South Korea. Korean J Ecol Environ 51(3): 221-233 (in Korean with English abstract).
[https://doi.org/10.11614/KSL.2018.51.3.221]

-
Nufio CR, McGuire CR, Bowers MD, Guralnick RP. 2010. Grasshopper community response to climatic change: Variation along an elevational gradient. PLoS ONE 5(9): e12977.
[https://doi.org/10.1371/journal.pone.0012977]

-
Oh YJ, Kim MH, Choi SK, Kim MK, Eo J, Yeob SJ, Bang JH, Lee YH. 2021. Prediction of the spatial distribution of suitable habitats for Geranium carolinianum under SSP scenarios. Ecol Resil Infrastruct 8(3): 154-163 (in Korean with English abstract).
[https://doi.org/10.17820/eri.2021.8.3.154]

- Park H, Kim M, Lee S. 2023. Adaption of phenological events in Seoul metropolitan and suburbs to climate change. J Environ Impact Assess 32(1): 49-59 (in Korean with English abstract).
-
Park JS. 2022. Spatial heterogeneity of environmental factors related to the invasion of Hypochaeris radicata in South Korea. Ecol Inform 71: 101784.
[https://doi.org/10.1016/j.ecoinf.2022.101784]

-
Parmesan C. 2006. Ecological and evolutionary responses to recent climate change. Annu Rev Ecol Evol Syst 37: 637-669.
[https://doi.org/10.1146/annurev.ecolsys.37.091305.110100]

- Phillips SJ, Dudík M, Schapire RE. 2021. Maxent software for modeling species niches and distributions (Version 3.4.1). http://biodiversityinformatics.amnh.org/open_source/maxent
-
Randin CF, Engler R, Normand S, Zappa M, Zimmermann NE, Pearman PB, Vittoz P, Thuiller W, Guisan A. 2009. Climate change and plant distribution: local models predict high-elevation persistence. Glob Chang Biol 15(6): 1557-1569.
[https://doi.org/10.1111/j.1365-2486.2008.01766.x]

-
Rosenzweig C, Karoly D, Vicarelli M, Neofotis P, Wu Q, Casassa G, Menzel A, Root TL, Estrella N, Seguin B, Tryjanowski P, Liu C, Rawlins S, Imeson A. 2008. Attributing physical and biological impacts to anthropogenic climate change. Nature 453: 353-357.
[https://doi.org/10.1038/nature06937]

-
Roy DB, Sparks TH. 2000. Phenology of British butterflies and climate change. Glob Chang Biol 6(4): 407-416.
[https://doi.org/10.1046/j.1365-2486.2000.00322.x]

-
Sparks TH, Jeffree EP, Jeffree CE. 2000. An examination of the relationship between flowering times and temperature at the national scale using long-term phenological records from the UK. Int J Biometeorol 44(2): 82-87.
[https://doi.org/10.1007/s004840000049]

-
Steer NC, Ramsay PM. Franco M. 2019. NLSTIMEDIST: An R package for the biologically meaningful quantification of unimodal phenology distributions. Methods Ecol Evol 10(11): 1934-1940.
[https://doi.org/10.1111/2041-210X.13293]

-
Swets JA. 1988. Measuring the accuracy of diagnostic systems. Science 240(4857): 1285-1293.
[https://doi.org/10.1126/science.3287615]

-
Vilà M, Espinar JL, Hejda M, Hulme PE, Jarošik V, Maron JL, Pergl J, Schaffner U, Sun Y, Pyšek P. 2011. Ecological impacts of invasive alien plants: A meta-analysis of their effects on species, communities and ecosystems. Ecol Lett 14: 702-708.
[https://doi.org/10.1111/j.1461-0248.2011.01628.x]

-
Walkovszky A. 1998. Changes in phenology of the locust tree (Robinia pseudoacacia L.) in Hungary. Int J Biometeorol 41(4): 155-160.
[https://doi.org/10.1007/s004840050069]

-
Walther GR, Post E, Convey P, Menzel A, Parmesan C, Beeebee TJC, Fromentin JM, Hoegh-Guldberg O, Bairlein F. 2002. Ecological responses to recent climate change. Nature 416: 389-395.
[https://doi.org/10.1038/416389a]

-
Wilting A, Cord A, Hearn AJ, Hesse D, Mohamed A, Traeholdt C, Cheyne SM, Sunarto S, Jayasilan MA, Ross J, Shapiro AC, Sebastian A, Dech S, Breitenmoser C, Sanderson J, Duckworth JW, Hofer H. 2010. Modelling the species distribution of flat-headed cats (Prionailurus planiceps), an endangered South-East Asian small felid. PLoS ONE 5(3): e9612.
[https://doi.org/10.1371/journal.pone.0009612]

-
Zimmermann NF, Jandl R, Hanewinkel M, Kunstler G, Kölling C., Gasparini P, Breznikar A, Meier ES, Normand S, Ulmer U, Gschwandtner T, Veit H, Naumann M, Falk W, Mellert K, Rizzo M, Skudnik M, Psomas A. 2013. Potential future ranges of tree species in the Alps. In: Cerbu GA, Hanewinkel M, Gerosa G, Jandl R (eds). Management strategies to adapt Alpine space forests to climate change risks. Rijeka: IntechOpen. p. 37-48.
[https://doi.org/10.5772/56279]

