Evaluating the economic impacts of Korea's NDC (nationally determined contributions) implementation via carbon pricing: A global multiregional computable general equilibrium analysis
Abstract
In April 2023, the Korean government announced its national emission pathways to achieve its 2030 NDC target of reducing GHG emissions by 40% compared to the 2018-level. The study provides an overview of the economic impacts of achieving the NDC target on the Korean economy, and particularly, it considers the different circumstances of the global mitigation efforts. The study collects the countries’ NDC target information, applies a global dynamic recursive CGE model with GTAP 11 database, and establishes seven scenarios with different global mitigation efforts and the recycling of carbon revenues. Three types of international cooperation scenarios are Global Cooperation, Partial cooperation without Korea, and Unilateral Commitment by Korea. The utilization of carbon revenues is another dimension of the scenarios. The result indicates that all regions experience negative impacts on real GDP under the Global Cooperation scenario with lump-sum tax transfer approach. With the labor tax recycling, the losses in real GDP decrease, and some regions, including Korea, show some positive economic impacts. Particularly, Korea experiences substantial benefits from double dividend. Moreover, Korea experiences relatively favorable impacts of carbon pricing on real GDI. In addition, all scenarios indicate some decrease in real exports and imports in all regions, and the result suggests that carbon pricing would lead to significant negative impacts on production, particularly of fossil fuel sectors. We also conduct a sensitivity analysis on key parameters, such as the elasticities of substitution between energy and genuine input factors, as well as those between different sources of energies.
Keywords:
Computable General Equilibrium, Nationally Determined Contribution, Economic Impacts, Carbon Revenue Recycling1. Introduction
The Republic of Korea (hereafter “Korea”) has enhanced its commitment to reduce its greenhouse gas emissions (GHG) since the country submitted its Intended Nationally Determined Contributions in 2015. In 2021, the Korean government submitted its enhanced Nationally Determined Contributions (NDC) with targets of reducing its GHG emissions by 40% in 2030 from the 2018-levelof 727.6 MtCO2eq (Government of Korea, 2021). It was a substantial enhancement from the previous reduction target of 26.3%, and the sectoral targets were enhanced significantly as well. Reducing GHG emissions by 40% within 12 years from the peak is an ambitious target even compared to other major countries and regions, such as the US, Japan, and the EU (Choi et al, 2021). The updated NDC also emphasized domestic mitigation efforts to achieve the national mitigation target. This ambitious goal reflected the government’s ambition to achieve carbon neutrality by 2050 and accelerate its low-carbon transition.
In April 2023, the Korean government announced its First Master Plan for Carbon Neutrality and Green Growth and revised its national pathway to achieve its 2030 NDC target. [Table 1] shows the difference between the updated NDC in 2021 and the revised pathways announced in the First Master Plan for Carbon Neutrality and Green Growth. Under the same target of reducing GHG emissions by 40% compared to the 2018-level, the Master Plan proposed yearly emission pathways for achieving the overall NDC target and the revised sectoral targets. It slightly reduced the burden of the industry sector from a 14.5% to a 11.4% reduction from 2018 levels and enhanced other sectors GHG reduction targets, such as the power sector, hydrogen, carbon capture, utilization and storage (CCUS), and overseas reductions. Within the limited remaining time until 2030, it would unlikely be possible to shift the industrial structure of Korea, which is largely dependent on energy- and carbon-intensive industries, such as steel and petrochemicals, towards low-carbon industries. While it reduced the emission reduction burden of the industry sector, the revision promotes more power generation from nuclear and renewable energy sources, more hydrogen utilization, including blue hydrogen, CCUS, and expanding the mitigation efforts in overseas countries (Government of Korea, 2023).
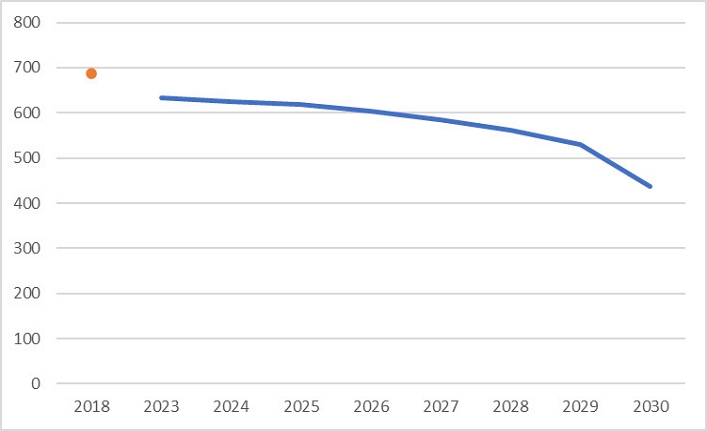
[Fig. 1] shows the annual emissions pathways (2023 ~ 2030) for achieving the NDC target by 2030. From its peak GHG emissions of 727.6 MtCO2eq in 2018, the country targets to reduce its GHG emissions gradually in the next few years and accelerate its mitigation efforts near 2030. To achieve the target, the Master Plan includes various measures in major sectors. For instance, in the power sector, which requires the reduction of GHG emissions by 45.9% from the 2018-level, the country will accelerate its transition towards low-carbon energy sources, such as renewables and nuclear, and improve demand-side efficiency. In the industry sector, the government plans to support industries to strengthen competitiveness by nurturing innovative technologies, providing financial supports for reducing carbon emissions, advancing the Korean Emission Trading Scheme (K-ETS) with higher allowance auctions and better allocation methods and improving governance. Moreover, the Master Plan estimates approximately over 88.9 trillion KRW would be required in the next five years, and the achievement of the NDC could bring about 0.01% increase in GDP, on average, relative to the BAU pathway until 2030 (Government of Korea, 2023). As the Korean government sets its pathways to achieve the NDC target, it becomes important to understand the economic impacts of achieving the NDC target on the Korean economy. Moreover, an increasing number of countries pledged to achieve carbon neutrality and the urgency and importance of achieving NDC targets are increasingly emphasized globally. The global climate actions and mitigation efforts to achieve NDC targets could bring direct or indirect economic impacts on the global economy as well as the Korean economy. Therefore, it would be necessary to assess the economic impacts of achieving its NDC target on the Korean economy under the consideration of the global mitigation efforts for their achieving NDC targets.
There has been a number of studies conducted on assessing the economic impacts of achieving NDC and Net Zero targets, and global computable general equilibrium (CGE) models are widely used to analyze the economic implications of achieving specific targets or introducing various climate policies, such as global or national carbon pricing. Moreover, some studies provide the economic impacts of climate policies, including the achievement of the NDC target, on the Korean economy. Depending on the model setting and assumptions, varying levels of economic impacts by country and region are suggested by different studies. den Elzen et al.(2022) utilized the updated NDCs submitted by countries until January 2022 and assessed the GHG emissions and the macroeconomic impacts. This study collected information from new and updated NDC submissions and applied a CGE model, the GEM-E3-FIT model. The research suggested global GDP losses would be about 0.4% by 2030 from the current policy scenario, and the economic impacts on Korea would be about 0.5% of GDP losses relative to the Current policy scenario, which is similar to other major economies, such as EU-27, Japan, and China. Wang et al.(2023) considered the NDCs of seven major economies (the US, the EU, Japan, China, India, Brazil and South Africa) and utilized the C-GEM (China-in-Global Energy Model) to analyze the economic costs of achieving the updated NDCs of those countries. This study also considered the equitable allocations of emissions and compared NDCs and equitable allocations. The study suggested that the GDP losses of Japan and China in 2030 (relative to the BAU level) would be around 0.5%, but South Africa could be significantly affected with around 2 ~ 2.5% losses relative to the BAU level. The economic costs of the other major economies would remain below 0.5% relative to the BAU level. Black et al.(2022) applied the IMF-ENV CGE model and analyzed the economic impacts of various ambitious scenarios, including achieving NDCs or the limiting warming to 2-degrees target, introducing the International Carbon Price Floor (ICPF) and reducing emission intensity of countries. This study classified countries by income groups (high-income, middle-income, low-income), and oil exporting countries are considered separately. According to the study, the achievement of the existing NDC targets would cause approximately less than 0.5% losses of global GDP relative to the BAU level. By region, it suggested the GDP costs (relative to the BAU level) would be relatively large for oil exporting countries and high-income countries, and the costs would be relatively less significant to middle-income and low-income countries. However, under the different ambitious scenarios, such as emission intensity reduction, ICPF, and high-equity limiting warming to 2-degrees scenario, the global GDP costs could become larger, and particularly, the middle- and low-income countries’ burdens could become quite larger than NDC scenario. At the country-level, the economic cost of achieving the NDC of Korea is approximately 0.5% losses of GDP from the BAU level, and this is relatively smaller than some major economies, such as the US, the EU and the UK. Xiaobei, Fan, and Jun (2022) considered the ICPF suggested by the IMF and national NDC targets and established scenarios to assess the economic impacts of climate policies. Under the NDC scenario, the real GDP losses of Korea relative to the BAU level would exceed 1% in 2030, and this level would be slightly larger than the US and Canada but lower than the EU, the UK and Japan. Literature suggests that the achievement of NDCs could bring a significant decrease of GHG emissions while the economic costs, such as GDP losses relative to the BAU level, would be limited. According to different model structures, assumptions, and scenarios, the levels of the suggested economic losses are somewhat different, but the economic losses of major economies in 2030 would be around 0.5% ~ 2% relative to the BAU level.
This study provides an overview of the economic impacts of the suggested emission pathways of Korea in achieving its NDC target by 2030. Particularly, it is necessary to analyze the economic impacts of achieving the NDC targets on the Korean economy under the different circumstances of the global mitigation efforts. Therefore, the study collects the NDC target information of countries, including Korea, and applies a global dynamic recursive computable general equilibrium (CGE) model to assess the economic impacts of achieving the targets on the Korean economy. The study utilized a global CGE model with GTAP 11 Database, which is the most up-to-date global dataset published in 2023. In addition, the study considers the impacts of the revenue recycling of carbon revenues and establishes separate scenarios to examine such policies, with one scenario including a lump-sum tax transfer to households and another scenario including reductions of labor tax.
2. Material and methods
2.1. Data collection
The study utilizes a multi-regional, multi-sectoral computable general equilibrium (CGE) model, and the model applies the GTAP 11 Database released in April 2023. GTAP 11 database extends its regional coverage to 141 countries and 19 aggregate regions and includes 65 products and services. The reference year of the database is 2017, and it is based on country-based Input Output Tables and additional data and information, such as from the International Energy Agency (IEA), UN-Comtrade statistics, etc. Moreover, this dataset provides more detailed GHG emission data, including CO2 and other non-CO2 emissions, which allow for an in-depth analysis of climate and energy policy (Aguiar et al., 2022).
In order to assess the economic impacts of global mitigation efforts, the study collected the NDC targets from the submitted NDC documents to the UNFCCC and the emissions information from various official documents, including Biennial Update Reports and National Inventory Reports, of Asian countries until March 2023. Moreover, the study collected the information of most of OECD countries1) as well. Based on the collected information, concrete global mitigation scenarios for achieving NDC targets were established.
The country classification is based on the Asian Development Bank (ADB) regional classification and generally follows (Kim et al., 2023), and the Republic of Korea is distinguished as a separate region as the study considers the specific yearly emissions pathway towards its NDC target and focuses on understanding the economic impacts of achieving NDC targets on Korea.
The base year of the study follows the latest reference year of GTAP 11 database, which is 2017 (Aguiar et al., 2022). To set the emission targets, the study collected information on emission levels in 2017 and calculated the rate of emissions reduction by 2030 based on the target information suggested by NDC documents. The emission coverage of the study is limited to CO2 emissions from the energy sector, the study tried to distinguish the CO2 emissions from the energy sector and to include the sectoral NDC target of the energy sector. If a country does not provide any information of sectoral emission data or NDC targets, the economy-wide emission data and NDC targets are used instead. If a country does not provide an absolute level emission reduction target and instead provides a target relative to BAU or intensity-based targets, the projections or forecasts from the NDC documents are primarily considered to convert those targets to absolute emissions levels. However, if there are no reliable forecasts available, or if the suggested forecasts are highly uncertain or excessive, the Shared Socio-economic Pathway 2 (SSP 2) scenario information is applied to calculate the absolute emissions level. For the Developing Country region, it is nearly impossible to review all NDCs and other documents for calculating absolute emissions levels, so this study simply averaged the rates of emissions reduction (%) required to achieve the NDC targets of the six regions, excluding Korea. In addition, the model used in this study considers gross emissions only, and the carbon dioxide removal or absorption via various measures, including carbon capture and storage, is not reflected. Korea provides detailed information on the emission pathway to achieve the NDC target, so the study considers the trajectory of gross CO2 emissions from energy combustion, excluding absorption, CCUS and overseas reduction. However, such information is not available to the other countries, the NDC targets of those countries are directly considered in the study.
2.2. Global CGE model
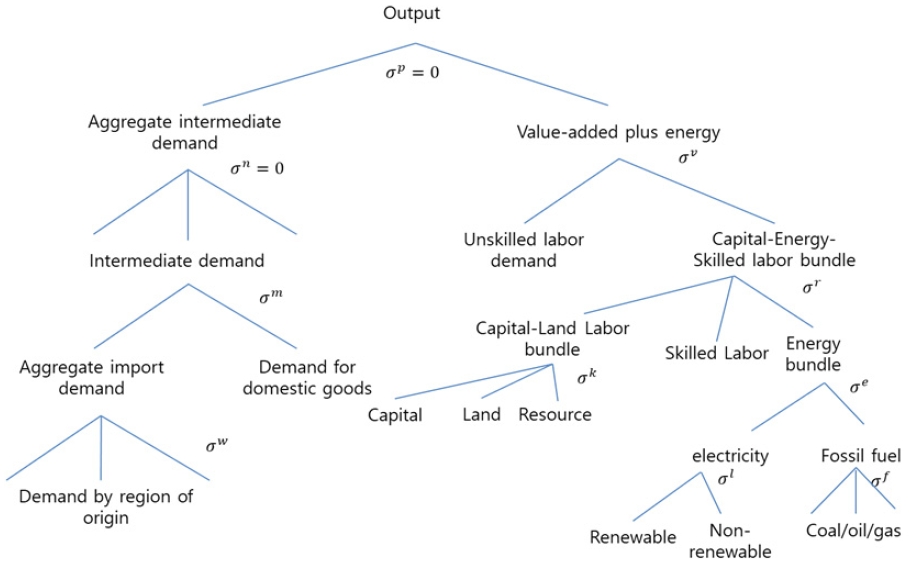
The study utilizes a dynamic recursive CGE model with a system of equations to analyze the interactions among the agents of an economy and finding the economy-wide equilibriums (Burfisher, 2017). The set of equilibrium conditions, such as (1) market equilibrium, (2) consumption demand functions, (3) current account balance conditions, budget constraints, and capital stock dynamics, (4) zero-profit conditions, and (5) factor supply functions are considered and found in the model (Jung et al., 2021; Kim et al., 2023). This CGE model has a dynamic recursive structure, which finds the equilibrium period-by-period. The model uses the nested constant elasticity of substitution (CES) production functions, and the nesting structure is built based on OECD ENV-Linkages Model (Chateau et al., 2014).
Moreover, the Armington Specification is applied to international trade, which allows the model to reflect the international trade of the same product type in both directions (import and export simultaneously). It applies a two-level nested CES structure. At the top-level, the domestic agent determines the optimal composite of domestic and imported goods. Then, the agent distributes the demand for the aggregate import across international trading partners. In addition, the model assumes that the household follows Cobb-Douglas utility, and the government budget remains constant at its base year level by the income tax adjustment (Jung et al., 2021, Kim et al., 2023).
The model generally uses the UN Population Prospect 2019 for population projections and SSP 2 Scenario for GDP calibration. For the OECD and Korea, the study utilizes the OECD’s long-term baseline projections in October 2021, which reflected the economic impacts of COVID-19 on the future economic growth, for calibration. The study distinguishes skilled and unskilled labor payments from the GTAP 11 database. The labor types are distinguished based on the International Labour Organization (ILO) occupation.
[Table 4] indicates the key parameters used in the model. If applicable, the model adopts the elasticity of substitution from the GTAP database, and for the substitution between KTR bundle (capital, land, and natural resources), energy, and skilled labor, the estimation results of Okagawa and Ban (2008) are applied. Their estimation results by industry classification are matched to the model sectors used in this study and the parameter values are used in the model of this research. The key parameter values can affect the analysis results, sometimes significantly, and the estimation results vary by research. Thus, sensitivity analysis will be conducted on the four key parameter values: Substitution between KTR bundle, energy, and skilled labor, substitution between electricity and fossil fuel, substitution between renewable and non-renewable electricity, and substitution between fossil energies.
The model consists of 20 sectors, and the following table indicates how 65 sectors from GTAP is aggregated to 20 sectors used in this model. It follows the GTAP sector classification, and some emission intensive industries are classified as a part of a sector. For example, cement industry is classified as a part of GTAP Sector ‘NMM’ (non-metallic minerals: cement, plaster, lime, gravel, concrete), which is included in the Chemical sector in this study (GTAP homepage. n.d.).
2.3. Scenario setting
We have formulated the policy instrument for implementing the NDCs as an economy-wide carbon pricing mechanism, encompassing all CO2 emissions arising from fossil fuel combustion. The carbon pricing includes carbon taxes and CO2 emission trading, both of which are formulated in a similar manner in mathematical equations under the CGE modeling framework. Carbon taxes are formulated with a fixed price of CO2 emissions, while CO2 emission trading is described as an emission constraint and an endogenous price variable in the simultaneous equation system for CGE.
The price-based policy and the quantity-based policy are interconnected in a dual relationship. In the price-based approach, the price is predetermined, and the total emissions are treated as a variable determined by market equilibrium conditions. Conversely, in the quantity-based approach, the total emission limit is predetermined, while the price becomes the variable. If the equilibrium total emission achieved through a carbon tax policy with a specific tax rate (e.g., $ per tCO2e) is enforced as the emission constraint for emissions trading policy simulation, the resulting equilibrium carbon price in the trading market will equal the specified tax rate for the carbon tax policy, and vice versa.
In an ideal scenario without factors such as uncertainty, transaction costs, imperfect competition, or information asymmetry, both carbon taxes and CO2 emissions trading can achieve the same equilibrium and yield identical effects within a mathematical equilibrium model.
We have developed seven distinct scenarios to assess the effects of various policy assumptions on CO2 mitigation and the Korean economy. These scenarios include a baseline scenario called “BAU” (Business as Usual), which represents the expected outcome in the absence of specific policy interventions. The other six scenarios represent different policy approaches for the two dimensions: types of international cooperation and the carbon pricing revenue recycling.
The three types of international cooperation scenarios are as follows:
- 1. Global Cooperation (‘NDC’): This scenario assumes that all countries collaborate and fully implement their Nationally Determined Contributions (NDCs) as agreed upon in international climate agreements.
- 2. Partial Cooperation without Korea (‘NoKOR’): This hypothetical scenario evaluates the impact of global cooperation on CO2 mitigation without the participation of Korea. It allows for assessing the impacts of policies implemented in foreign regions when Korea free-rides in the global mitigation cooperation. This hypothetical scenario provides a useful basis to get the additional impact from Korea’s mitigation effort by comparing with the global cooperation.
- 3. Unilateral Commitment by Korea (‘OnlyKOR’): This scenario represents a situation where Korea takes unilateral action to implement CO2 mitigation policies, while other countries do not undertake any significant mitigation efforts. This extreme case helps evaluate the impacts of Korea's NDC implementation in isolation.
Another dimension of the scenarios is the utilization of revenue generated from carbon pricing. The evaluation of economic consequences resulting from carbon pricing strongly relies on how the revenue is recycled. In our analysis, we consider two common approaches for revenue recycling: lump-sum transfers to households and labor tax cuts. Scenarios labeled with ‘recy’ at the end indicate the implementation of carbon pricing with revenue recycling through reductions in labor taxes. This approach aims to alleviate the tax burden on labor, potentially stimulating economic growth and promoting job creation. In contrast, scenarios without the ‘recy’ label assume that the revenue is allocated as lump-sum transfers directly to households. This approach provides households with additional income, which can positively influence consumption patterns and support overall economic well-being.
The allocation of carbon pricing revenue is a crucial factor in assessing the overall impact on the economy. By implementing carbon pricing, we can generate revenue that can be strategically directed to mitigate the economic effects of such policies. The two approaches we consider, lump-sum transfers and labor tax cuts, offer distinct mechanisms for recycling this revenue. The choice between these two recycling methods depends on various factors, including the specific economic context, policy objectives, and societal considerations. By exploring these different scenarios, we can gain insights into the potential outcomes and trade-offs associated with different revenue recycling strategies within the context of carbon pricing.
3. Results
3.1. Results: Base case
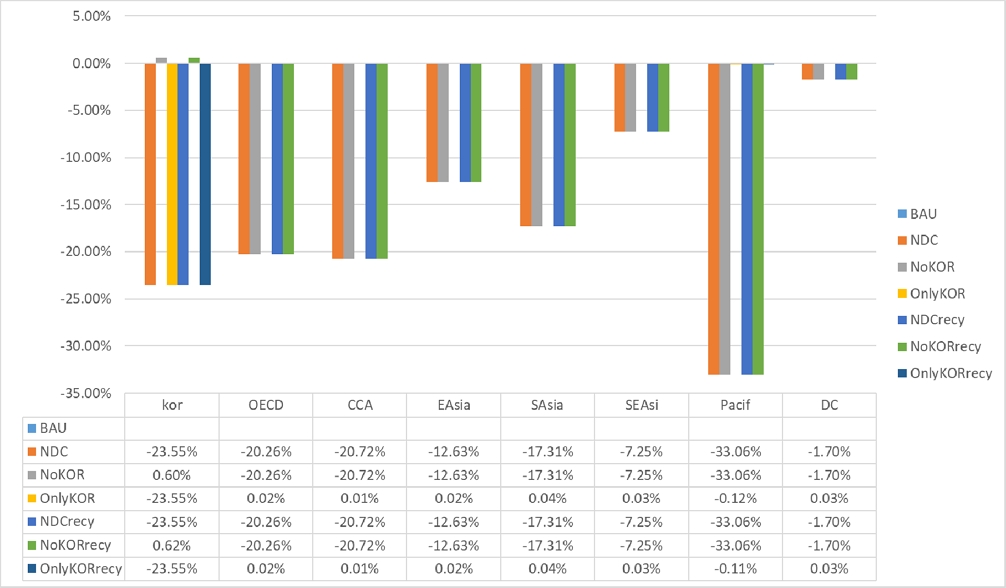
[Fig. 3] illustrates the emissions changes by scenarios compared to BAU for 2024 ~ 2030 period. The emission reduction rate from the BAU baseline is highest for ‘Pacif’, followed by Korea, ‘CCA’, ‘OECD’ and ‘SAsia’ and lowest for ‘DC’. The percentage reductions relative to the BAU baseline emissions can be interpreted as indicators of the strength of mitigation commitments. In this regard, Korea stands out as the second most ambitious region after ‘Pacif’ in terms of the level of ambition in its NDC.
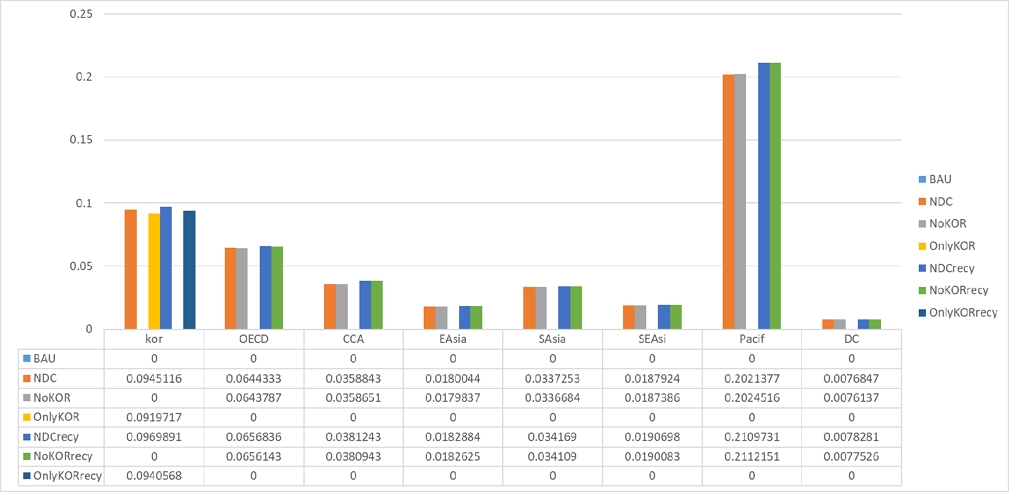
The figure presented below illustrates the carbon prices necessary for individual regions to meet their NDCs in 2030. The required carbon prices tend to align closely with the strength of the NDCs, resulting in higher prices for regions with more ambitious commitment. Specifically, the highest carbon price is observed for the ‘Pacif’ region, followed by Korea. The carbon price of 94.5 USD/tCO2 for Korea is much higher than the current carbon price observed in Korean ETS, which indicates the possibility that the market price of CO2 allowances is likely to increase significantly as the emission cap tightens to correspond to the stronger mitigation targets near 2030. It is worth noting that the carbon prices are higher when revenue recycling is implemented through labor tax cuts compared to a lump-sum transfer to households. However, the disparity between these two approaches is relatively small, indicating a limited difference in terms of the resulting carbon prices.
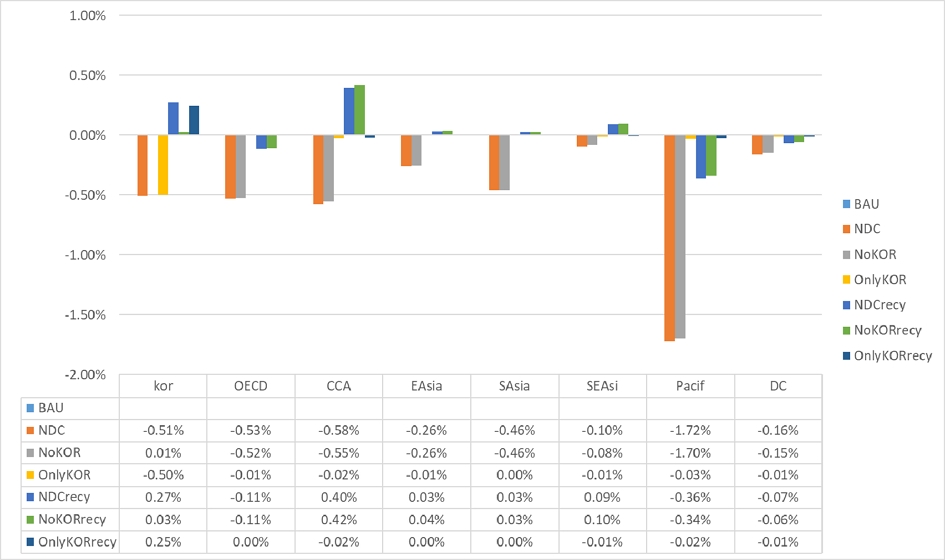
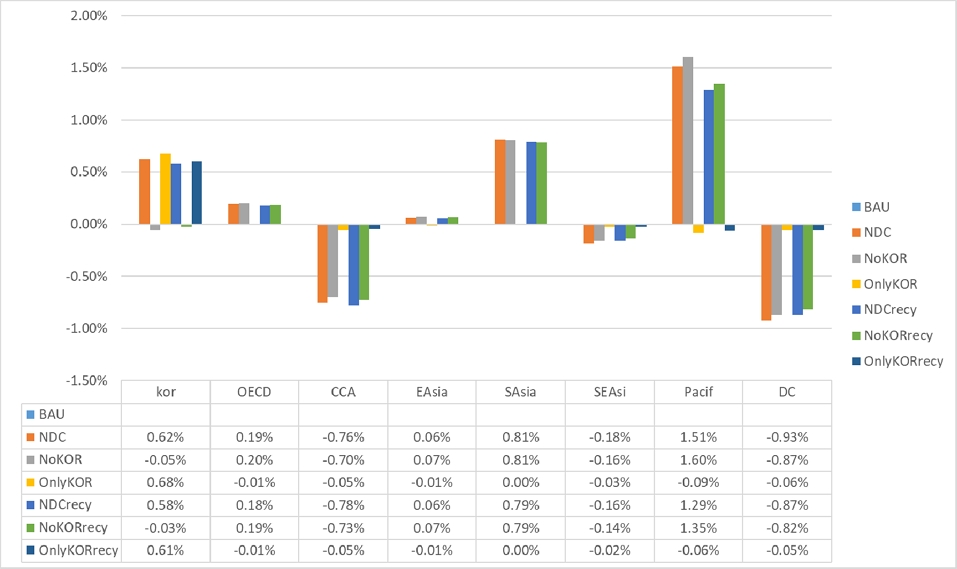
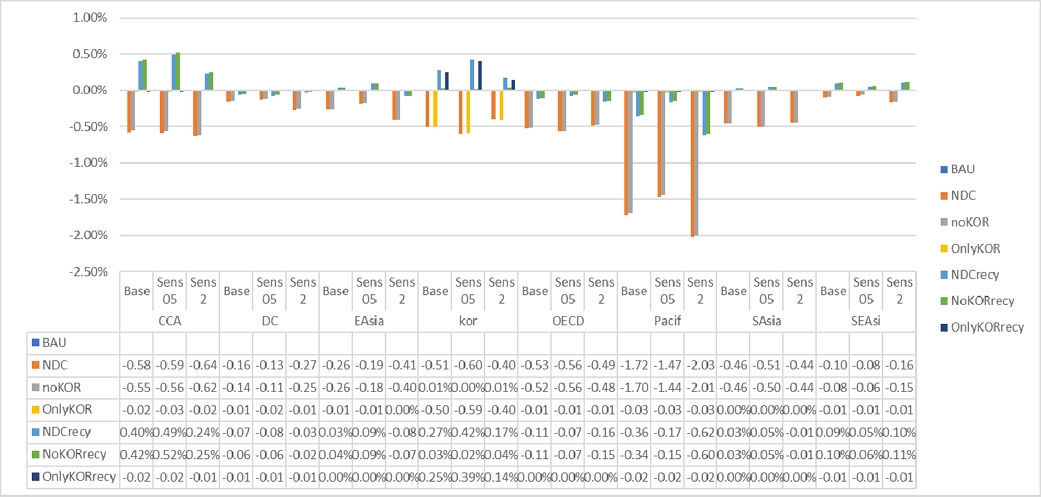
The impacts on real GDP exhibit a wide range of variations across different policy assumptions. When considering the global implementation of regional NDCs, all regions experience negative impacts on real GDP under the lump-sum transfer approach for carbon pricing revenue. However, the degree of impact varies, ranging from -0.10% to -1.72% compared to the BAU scenario. In contrast, under the labor tax recycling approach, the loss in real GDP significantly diminishes, and certain regions such as Korea, CCA, and SEAsi even observe positive impacts. This demonstrates a strong double dividend effect of carbon pricing, indicating the potential for improving both economic and environmental performance through CO2 regulation.
Of particular significance is the case of Korea and CCA, which are expected to benefit significantly from the strong double dividend. In the ‘NDC’ scenario, Korea experiences a real GDP impact of -0.52%, while under the ‘NDCrecy’ scenario with labor tax recycling, this impact changes to a positive value of +0.27%. Notably, Korea benefits from carbon pricing when labor tax recycling is employed, resulting in a higher real GDP compared to the scenario without carbon pricing. This stands in contrast to the reversed outcome observed under the lump-sum transfer approach. These findings highlight the potential for improved economic performance through effective utilization of revenue from carbon pricing.
The CGE modeling analysis underscores the remarkable effect of revenue recycling in conjunction with carbon pricing. It reveals that the economic impacts of carbon pricing vary significantly depending on the approach taken for revenue utilization.
The evaluation of the real GDP impacts for Korea resulting from the implementation of NDCs can be approached by examining the ‘NDC’ scenario, which yields a -0.51% impact for Korea. However, this figure encompasses not only the impact of Korea's NDC implementation but also the effects of policy measures undertaken by other regions. To isolate the impact solely attributable to Korean policy efforts, it is more reasonable to consider the difference between the ‘NDC’ and ‘NoKOR’ scenarios, which amounts to -0.52% (obtained as -0.51% minus 0.01%). This represents the opportunity cost of Korean NDC implementation within the context of all other regions pursuing their respective NDCs.
Another approach to evaluating the policy cost linked to Korean mitigation efforts is through the ‘OnlyKOR’ scenario, which measures the impact of Korean NDC implementation under the assumption that no efforts are made by other regions. These two evaluation methods yield different possibilities, representing extreme assumptions about the foreign policy environments. [Fig. 5] demonstrates a slight difference between the two estimates, with a gap of 0.02% (-0.52% using the former method and -0.50% using the latter). For the case of labor tax recycling, the gap is even smaller at 0.01%, obtained as the difference between 0.24% (derived from ‘NDCrcy’ at 0.27% minus ‘NoKORrecy’ at 0.03%) and 0.25% (‘OnlyKORrecy’). Across both revenue recycling scenarios, the policy impacts are found to be more favorable for Korea when assuming no mitigation efforts by foreign regions, compared to the scenario involving NDC implementations in all foreign regions. The impact of Korean NDC implementation estimated by the study, in terms of GDP, indicates a similar level compared to the other literature.
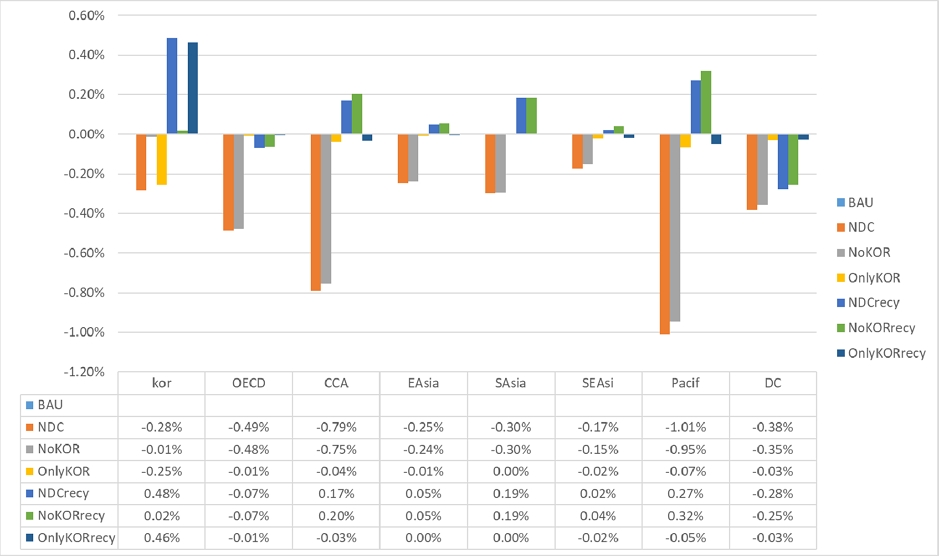
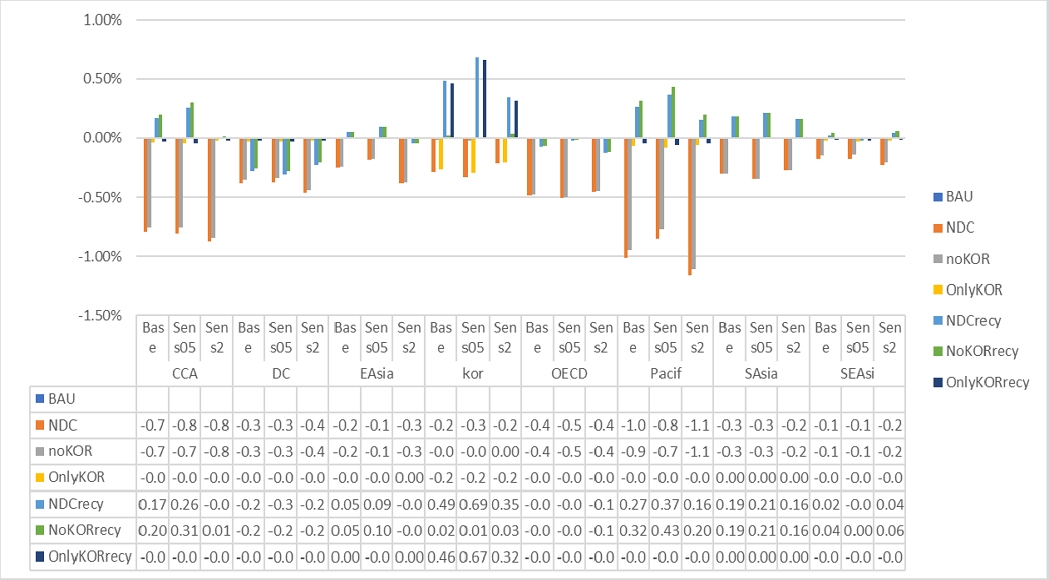
The impacts of carbon pricing on real Gross Domestic Income (GDI) tend to be more favorable for several regions, including Korea. However, some regions, such as CCA, SEAsi, and DC, experience a worse outcome in terms of real GDI compared to real GDP. Specifically, the implementation of global NDCs with carbon pricing leads to a significantly lower real GDI impact of -0.28% for Korea, as opposed to a real GDP impact of -0.51% under the same policy scenario. Moreover, the utilization of labor tax recycling demonstrates a substantial improvement in real GDI, with a gain of 0.48%, surpassing the corresponding real GDP gain of 0.27%.
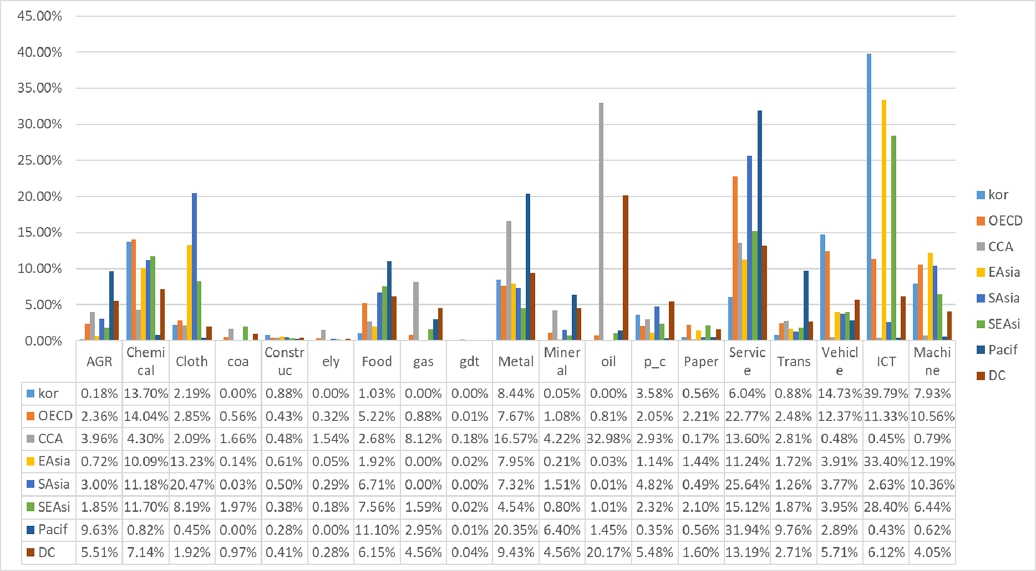
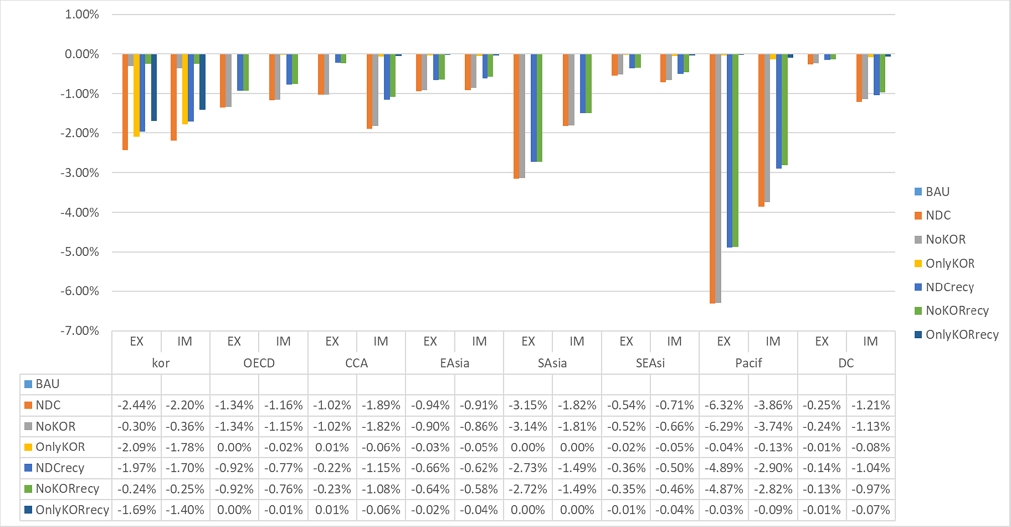
The difference in impacts between real GDI and real GDP is closely related with the change of terms of trade, which is the ratio between a region’s export prices and its import prices. Global cooperation with carbon pricing results in better terms of trade for Korea, ‘OECD’, ‘SAsia’ and ‘Pacific’ but in lower terms of trade for ‘CCA’, ‘SEAsi’ and ‘DC’. ‘CCA’ and ‘DC’ are the regions with high shares of oil and gas in their exports [Fig. 7] and the decrease of these fossil fuel prices due to the lower demand caused by CO2 regulation results in the worse terms of trade for these regions.
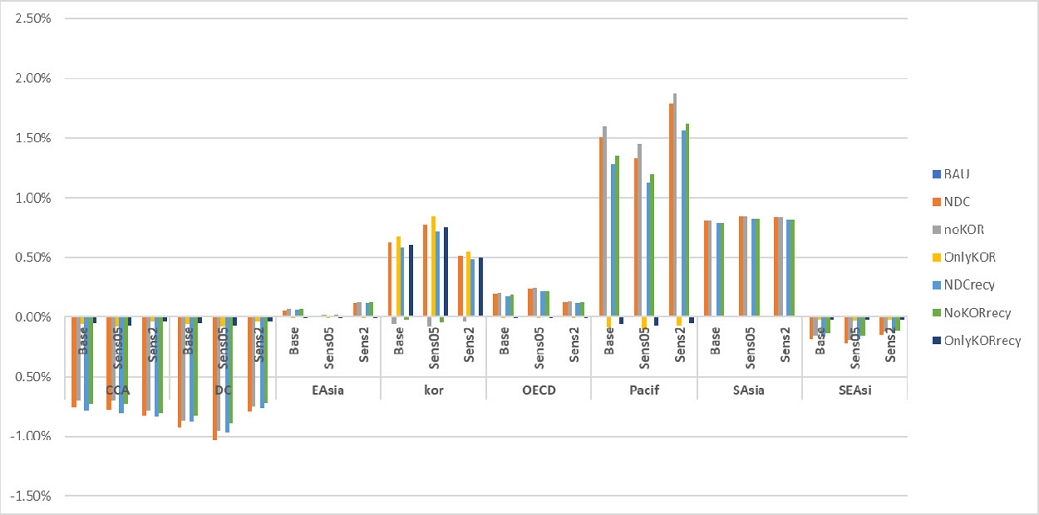
Under all scenarios, there is a decrease in real exports and imports across all regions. However, the rate of decline in trade is comparatively lower in the labor tax recycling scenarios compared to the lump-sum transfer scenarios, similar to other economic indicators such as real GDP. Generally, regions experiencing an improvement in terms of trade witness a greater decrease in real exports than real imports, while regions with deteriorating terms of trade observe the opposite trend. This observation aligns closely with the assumption of the current account balance condition in the CGE model.
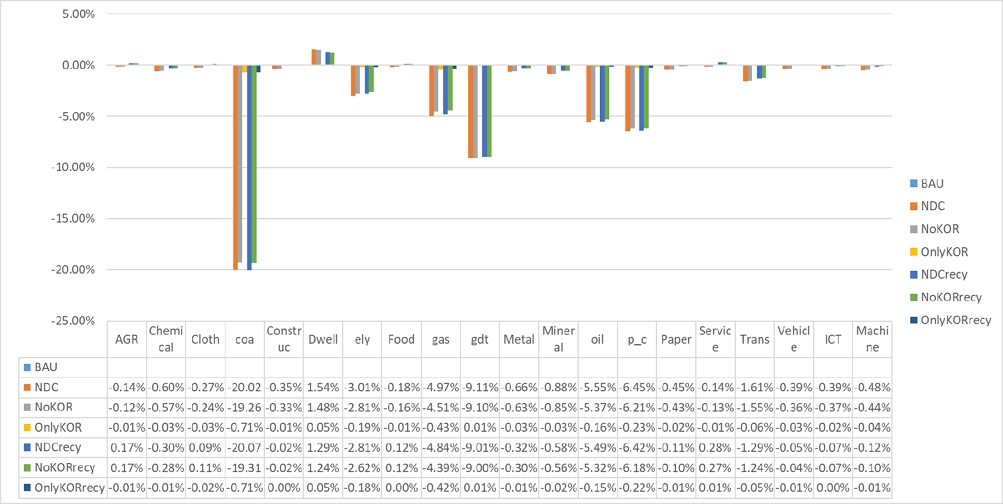
[Fig. 11] provides the impacts of carbon pricing scenarios on sectoral productions. We can identify significant negative impacts on fossil fuel sectors such as coal (‘coa’), gas, oil, gas distribution (‘gdt’), petroleum and coal product (‘p_c’), power (‘ely’) and transportation (‘Trans’), while there is a positive impact on housing sector (‘Dwell’). For the scenarios for unilateral NDC implementation only for Korea, the impacts on global productions are quite low, below 1%, although the pattern of sector-by-sector variance pattern aligns closely with the global NDC scenarios.
The impacts on sectoral production in Korea exhibit similar trends to those observed in the global economy. The fossil fuel sectors experience a negative impact, while certain service sectors, notably the housing sector, demonstrate gains in terms of production. The disparity in production changes between the two revenue recycling scenarios is minimal, deviating from the observed trend in real GDP impacts. Moreover, if Korea were to engage in global cooperation without bearing its fair share of emission reductions, a greater number of sectors would benefit in terms of production (‘NoKOR’ or ‘NoKORrecy’).
3.2. Sensitivity analysis
As stated above, the study applies sensitivity analysis to the four key parameter values (Substitution between KTR bundle, energy, and skilled labor, substitution between electricity and fossil fuel, substitution between renewable and non-renewable electricity, and substitution between fossil energies) to assess the robustness of the results from the analysis. The stated parameter values are the Base case, and the study introduces two additional cases. In the first additional case (“Sens2”) all four key parameter values are multiplied by two, and in the second additional case (“Sens05”) all four key parameter values are halved.
The sensitivity analysis indicates the increase or decrease in elasticities of substitution parameter values suggest mixed results depending on regions, carbon revenue recycling, and scenarios. For instance, the OECD region indicates the lower elasticities bring larger real GDP losses from BAU compared to the Base case, if there is no carbon revenue recycling, but bring better results compared to the Base case, if there is carbon revenue recycling. In the case of Korea, if there is no revenue recycling, lower elasticities would worsen the changes in real GDP from BAU, but higher elasticities would improve the changes in real GDP from BAU, compared to the Base case. If there is revenue recycling, the result is mixed. Under “Sens05” case, changes in real GDP from BAU are better in “NDCrecy” and “OnlyKORrecy”, but slightly worsen in “NoKORrecy”. Under “Sens2” case, changes in real GDP from BAU are better in “NoKORrecy” but worsen in “NDCrecy” and “OnlyKORrecy”. Moreover, without revenue recycling, many developing regions, such as DC, EAsia, Pacif, and SEAsi, indicate that losses in real GDP from BAU become smaller under “Sens05” case, and larger under “Sens2” case, if they implement mitigation efforts (“NDC” and “noKOR”). With revenue recycling, all regions except “DC” and “SEAsi” show better changes in real GDP from BAU under “Sens05” case, and worse under “Sens2” case, if they implement mitigation efforts. The sensitivity results of real GDI indicates very similar results to the sensitivity results of real GDP, except for few exceptions. Under “Sens05”, the directions of changes in real GDI from BAU are the same as those in real GDP from BAU in all scenarios and regions, except (“OECD” and “SAsia” in “OnlyKORrecy”). Under “Sens2”, the directions of changes in real GDP and real GDI show the same results in all regions and scenarios, except for “DC” region in “OnlyKOR” and “OnlyKORrecy” scenarios.
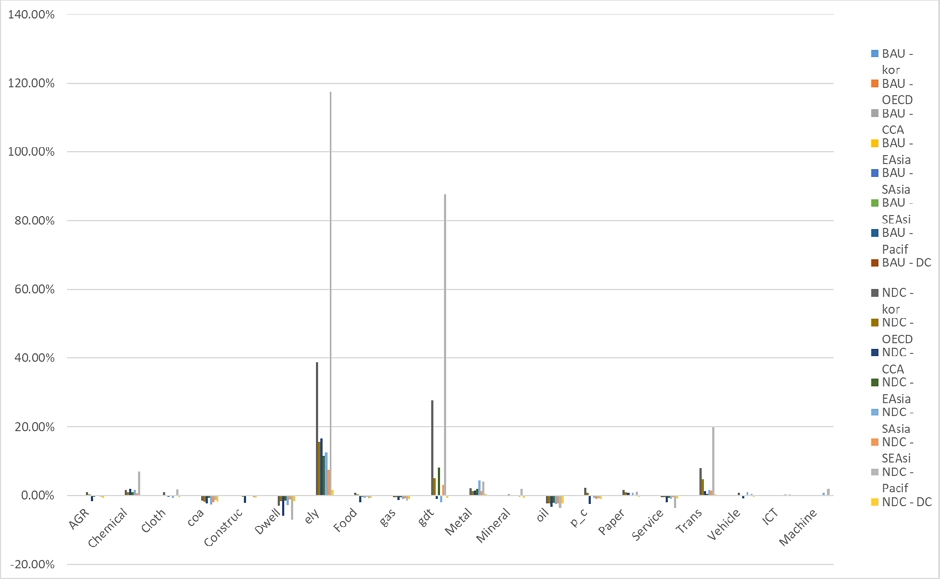
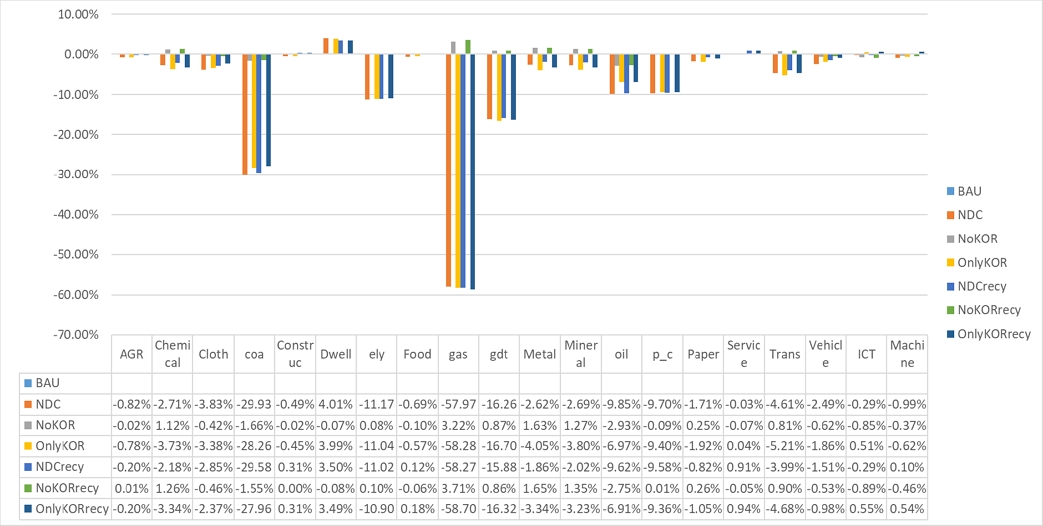
[Fig. 15] indicates the sensitivity analysis on global production by sector. Focusing on key energy and electricity sectors, which are significantly affected by scenario, the sensitivity analysis shows somewhat mixed results. For ‘coal’ sector, the losses of global production from BAU become smaller, compared to the Base case, when the elasticities of substitution become smaller in all scenarios (and losses become larger when the elasticities of substitution become larger). On the contrary, the losses of global production from BAU in “ely” and “gas” sectors become larger, compared to the Base case, with larger elasticities of substitution in all scenarios (and losses become smaller with smaller elasticities of substitution). The other energy sectors indicate somewhat mixed results by scenario. For instance, ‘petroleum and coal product’ sector shows the losses of global production from BAU become smaller, compared to the Base case, under “Sens05” (and larger under “Sens2”) in “NDC”, “noKOR”, “NDCrecy”, and “NoKORrecy” scenarios. However, in “OnlyKOR” and “OnlyKORrecy” scenarios, it becomes opposite, and the production losses (from BAU) become larger, compared to the Base case, when the elasticities of substitution become smaller (and the production losses become smaller when the elasticities of substitution become larger).
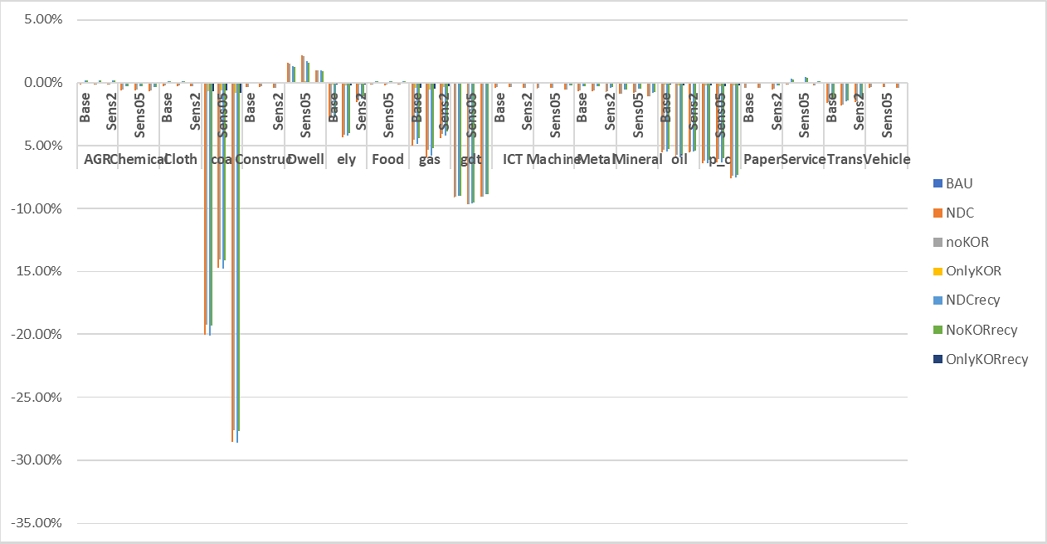
Sensitivity analysis: Impacts of carbon pricing scenarios on global production by sectors (change from BAU, 2024 ~ 2030)

Sensitivity analysis: Changes in real GDP and real GDI by region and scenario (changes from BAU, 2024 ~ 2030)
As stated in the previous section, the changes of terms of trade are closely linked to the difference of impacts between real GDP and real GDI. Generally, the smaller elasticities of substitutions (“Sens05”) would result in almost same or better terms of trade for OECD and South Asia, but worse terms of trade for other regions. In the case of Korea, lower elasticities of substitutions bring better terms of trade, but the terms of trade become slightly worse in ‘noKOR’ and ‘noKORrecy’ scenarios. The larger elasticities of substitutions (“Sens2”) would result in almost same or better terms of trade for Developing Countries, East Asia, Pacific, South Asia, and Southeast Asia, but worse terms of trade for the OECD and Caucasus and Central Asia. In the case of Korea, the larger elasticities of substitutions (“Sens2”) would bring slightly better results for terms of trade in ‘noKOR’ and ‘noKORrecy’ scenarios. However, the terms of trade of Korea worsen under the other scenarios when the elasticities of substitution become larger.
4. Conclusions and discussions
In this study, we have developed a global multiregional dynamic computable general equilibrium (CGE) model to evaluate the economic impacts of regional NDC implementation via carbon pricing. We have examined the effects of different policy assumptions on CO2 mitigation and the Korean economy using an economy-wide carbon pricing mechanism. We formulated seven scenarios, including a baseline scenario representing the expected outcome without policy interventions (BAU). The scenarios covered two dimensions: types of international cooperation and carbon pricing revenue recycling.
For international cooperation, we considered scenarios of global cooperation (NDC), partial cooperation without Korea (NoKOR), and unilateral commitment by Korea (OnlyKOR). These scenarios allowed us to assess the impacts of policy efforts undertaken by Korea and other regions.
Regarding revenue recycling, we explored two approaches: lump-sum transfers to households and labor tax cuts. Scenarios with “recy” at the end represented carbon pricing with revenue recycling through labor tax reductions, while scenarios without “recy” allocated revenue as lump-sum transfers to households.
Our analysis revealed that Korea displayed significant ambition in its NDC implementation, ranking second after the Pacific region. The required carbon prices aligned with the strength of the NDCs, with higher prices for regions with more ambitious commitments.
The impacts on real GDP varied across scenarios. Under global NDC implementation with a lump-sum transfer approach, all regions experienced negative impacts, though to different degrees. However, under labor tax recycling, the real GDP loss diminished significantly, and some regions, including Korea, observed positive impacts. This demonstrated the potential for a strong double dividend effect of carbon pricing, benefiting both the economy and the environment.
The evaluation of the real GDP impact specifically for Korea requires isolating the impacts solely attributable to Korean policy efforts. Comparing the “NDC” scenario with the “NoKOR” scenario provided a reasonable estimate of the impact. We also evaluated the impacts in the “OnlyKOR” scenario, assuming no efforts by other regions. These evaluations presented different possibilities based on extreme assumptions about foreign policy environments.
The impacts on real Gross Domestic Income (GDI) were more favorable for several regions, including Korea, under carbon pricing scenarios. The use of labor tax recycling led to a substantial improvement in real GDI compared to lump-sum transfers.
There were significant negative impacts on fossil fuel sectors and a positive impact on the housing sector across scenarios. The impacts on global production for unilateral NDC implementation by Korea were relatively low but exhibited similar sector-by-sector variation as the global NDC scenarios.
This study highlights the potential benefits of implementing an economy-wide carbon pricing mechanism to achieve CO2 mitigation goals while considering different policy assumptions. The analysis demonstrated that the strength of NDC commitments, revenue recycling approaches, and international cooperation significantly influenced the impacts on various economic indicators, including real GDP and real GDI.
Korea emerged as one of the most ambitious regions in terms of its NDC implementation. The utilization of revenue from carbon pricing, particularly through labor tax reductions, showed positive economic impacts and the potential for a strong double dividend effect. This suggests that effective revenue recycling strategies can lead to improved economic performance alongside environmental goals.
The evaluation of policy impacts necessitated careful consideration of foreign policy environments and the specific contributions of Korean policy efforts. Assessing the impacts on sectoral production further emphasized the diverse effects of carbon pricing on different sectors, particularly fossil fuel sectors and the housing sector.
Moreover, the expected losses from the country’s mitigation efforts are relatively small, compared to the amount of emission reductions achieved by the implementation of NDCs. This study does not incorporate the co-benefits, such as health benefits, which can be achieved by the implementation of NDCs. This could alleviate the expected economic losses from achieving NDC targets.
Overall, the findings underscore the importance of well-designed policy instruments, international cooperation, and revenue recycling strategies in achieving CO2 mitigation targets while minimizing adverse economic consequences. This study provides valuable insights for policymakers and stakeholders in Korea and other regions seeking to develop effective climate change mitigation strategies.
Acknowledgments
This work was supported by Korea Environment Industry & Technology Institute (KEITI) through “Climate Change R&D Project for New Climate Regime.”, funded by Korea Ministry of Environment (MOE) (2022003560010).
Notes
References
-
Aguiar A, Chepeliev M, Corong E, Mensbrugghe D. 2022. The global trade analysis project (GTAP) data base: Version 11. Journal of Global Economic Analysis. 7(2): 1-37.
[https://doi.org/10.21642/JGEA.070201AF]

- Black S, Chateau J, Jaumotte F, Parry I, Schwerhoff G, Thube S, Zhunussova K. 2022. Getting on Track to Net Zero: Accelerating a Global Just Transition in This Decade. Washington, DC, United States: International Monetary Fund. IMF Staff Climate Note 2022/010.
-
Burfisher, M. 2017. Introduction to computable general equilibrium models (second edition). Cambridge: Cambridge University Press.
[https://doi.org/10.1017/9781316450741]

-
Château J, Dellink R, Lanzi E. 2014. An Overview of the OECD ENV-Linkages Model: Version 3. Paris, France: OECD Publishing. OECD Environment Working Papers. 65.
[https://doi.org/10.1787/5jz2qck2b2vd-en]

- Choi H, Lim H, Jung E, Lee S. 2021. Significance and future challenges of the enhanced 2030 nationally determined contributions (NDC) [in Korean]. Sejong, Korea: Korea Environment Institute. KEI Focus. 9(11). https://www.kei.re.kr/board.es?mid=a10102020000&bid=0028&list_no=57707&act=view
-
den Elzen MGJ, Dafnomilis I, Forsell N, Fragkos P, Fragkiadakis K, Höhne N, Kuramochi T, Nascimento L, Roelfsema M, van Soest H, Sperling F. 2022. Updated nationally determined contributions collectively raise ambition levels but need strengthening further to keep Paris goals within reach. Mitigation and Adaptation Strategies for Global Change. 27(33).
[https://doi.org/10.1007/s11027-022-10008-7]

- Government of Korea. 2021. Submission under the Paris Agreement: The Republic of Korea’s enhanced update of its First Nationally Determined Contribution. [Accessed on May 18]. https://unfccc.int/sites/default/files/NDC/2022-06/211223_The%20Republic%20of%20Korea%27s%20Enhanced%20Update%20of%20its%20First%20Nationally%20Determined%20Contribution_211227_editorial%20change.pdf
- Government of Korea. 2023. First master plan for carbon neutrality and green growth [in Korean]. [Accessed on April 20]. https://www.2050cnc.go.kr/base/board/read?boardManagementNo=2&boardNo=1462&menuLevel=2&menuNo=16
- GTAP Homepage. GTAP Data Bases: 57 Detailed Sectoral List. [accessed on June 16, 2023]. https://www.gtap.agecon.purdue.edu/databases/contribute/detailedsector57.asp
-
Jung T, Kim Y, Moon J. 2021. The impact of demographic changes on CO2 emission profiles: Cases of East Asian Countries. Sustainability. 13(2). 677.
[https://doi.org/10.3390/su13020677]

- Kim Y, Jung T, Moon J, Kim J, Estrada G. 2023. Costs and benefits of low carbon transition in Asia. Manila, Philippines: Asian Development Bank. Asian Development Outlook 2023 Thematic Report Background Papers.
- Okagawa B, Ban K. 2008. Estimation of substitution elasticities for CGE models. Osaka, Japan: Osaka School of International Public Policy (OSIPP). Discussion paper 08-16. https://www2.econ.osaka-u.ac.jp/econ_society/dp/0816.pdf
-
Wang H-L, Weng Y-Y, Pan X-Z. 2023. Comparison and analysis of mitigation ambitions of Parties’ updated Nationally Determined Contributions. Advances in Climate Change Research, 14(1): 4-12.
[https://doi.org/10.1016/j.accre.2022.10.001]

- Xioabei H, Fan Z, Jun M. 2022. An analysis of the IMF’s International Carbon Price Floor Proposal. https://www.bu.edu/gdp/files/2022/09/TF_WP_012_PKU_FIN.pdf

