Double-entry accounting system for greenhouse gases: Can carbon neutrality mitigate climate change?
Abstract
This study explores whether carbon neutrality policies can mitigate climate change. A double-entry accounting report of greenhouse gases was developed for this purpose. The accounting report integrated both the flow amount (emissions and absorption) and the stock amount of carbon dioxide to compare the two values using a unified unit of measurement. Based on the accounting report, the stock of carbon dioxide in the global atmosphere at the end of 2021 was estimated to be 3,246.6 billion tons. The accounting report also indicates that the annual emission from human activities was 39.3 billion tons, while absorption by land and ocean ecology is 22.7 billion tons. Consequently, the net emission of carbon dioxide was 16.6 billion tons in 2021. Even if all countries achieve carbon neutrality, the atmospheric stock of carbon dioxide will remain at 3,246.6 billion tons, which is 1,080.8 billion tons more than in the year 1750. Hence, abnormal climate phenomena will persist. Given that the annual anthropogenic emission of 39.3 billion tons and net emission of 16.6 billion tons only accounts for approximately 3.6% and 1.5% of that 1,080.8 billion-ton surplus, respectively, carbon neutrality alone may not reduce the surplus fast enough to avoid natural disasters from climate change. Therefore, this double-entry accounting report on greenhouse gases shows that preventing climate change through carbon neutrality alone will be difficult, and highlights the need for alternative approaches.
Keywords:
CO2, Flow, Stock, Material Flow Analysis, Net Zero1. Introduction
The Intergovernmental Panel on Climate Change (IPCC) released its Sixth Assessment Report in 2021 and approved it in March 2023. According to its summary for policymakers (IPCC, 2021), human-induced climate change is causing widespread and rapid changes to the climate system. This report emphasizes that limiting global warming requires net zero CO2 emissions.
Net Zero, or carbon neutrality refers to a state where the anthropogenic emissions of carbon dioxide by a certain entity are balanced by anthropogenic removals over a specific period (Rogelj et al., 2015; Wei et al., 2022). It is claimed that carbon neutrality can be achieved by increasing greenhouse gas absorption sources such as forests or reducing emissions by decreasing fossil fuel use. After the UN Climate Change Conference in 2015, in which countries pledged to achieve carbon neutrality by 2050 (Schreyer et al., 2020), the carbon neutrality has become the key to countries' climate change response strategies (Chen et al., 2022; UNEP, 2022). In South Korea, too, carbon neutrality has been pursued as the most important goal since the Green New Deal Plan was launched in 2020 (Lee et al., 2020).
However, is it true that carbon neutrality is an effective means of addressing climate change? If we reduce emissions by achieving carbon neutrality, does it mean that climate change will no longer occur? To answer these questions, we first need to know the amount of carbon dioxide (CO2) in the atmosphere, as well as the amount of CO2 that humans emit each year. By integrating these two kinds of information, we might be able to predict how mush CO2 in the air will decrease if we decrease its emission in a certain period.
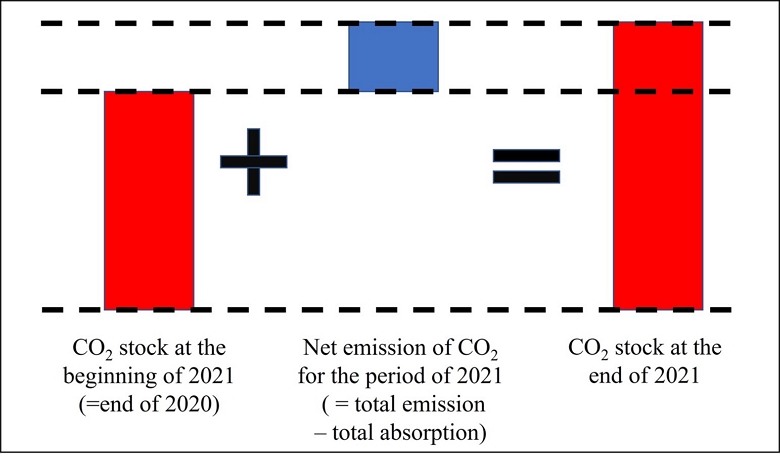
However, many reports on climate change that have been released so far do not compare or integrate these two different kinds of information. It is easy to hear that the concentration of greenhouse gases in the atmosphere has increased from less than 300 ppm (particle per million) before industrialization to about 400 ppm in 2010 (e.g., Beck, 2007). It is also easy to find out that about 35 billion tons of CO2 are emitted in a year by human activities around 2010 (e.g., Janssens-Maenhout et al., 2017). However, the measuring unit of concentration of greenhouse gases (usually, ppm) is not the same as the measuring unit of emitted amount (usually, tons). So they cannot be compared with each other. Moreover, with these two different measuring units, we cannot examine the simple equation showing that the CO2 stock at the end of a certain period is the sum of the CO2 stock at the beginning of the period and the net emission during the period (Fig. 1).
The solution to this problem is the double-entry accounting system for greenhouse gases. The double-entry accounting system shows both flow and stock separately, and also shows how the flow and stock are related to each other. In the case of the double-entry accounting report of private companies, the flow of revenue and expenditure for a certain period is shown on an income statement, and the stock of assets and liabilities are shown on the balance sheet, and the connection of the flow and the stock is explained on an “statement of changes in capital.” Likewise, if the figures related to the greenhouse gases are shown on these tables made by double-entry accounting system, the figures will be more easily understandable.
Therefore, this paper aims to present a double-entry accounting system for greenhouse gases. By inputting information on the amount of greenhouse gases already known into this accounting system, we will compare the amount of greenhouse gas emissions and the amount of greenhouse gases in the atmosphere. By comparing these, we will examine how much the amount of greenhouse gases in the atmosphere will decrease through carbon neutrality policies that reduce greenhouse gas emissions. Through this, we will determine whether carbon neutrality policies are effective in mitigating climate change.
2. Method
2.1. Double-entry accounting system for material flow analysis
Many quantities in the world can be distinguished into flows, which represent changes over a period of time, and stocks, which represent quantities at a specific point in time (Fisher, 1896). For example, if there are 100 liters of water in a container, this is a stock. If a hole is made at the bottom of the container and 1 liter of water flows out per minute, this is a flow. Flows and stocks are connected through time. In the example above, it would take 100 minutes for all 100 liters of stock to flow out of the container.
Similarly, the amount of greenhouse gases on the earth can also be distinguished into flows and stocks (Fig. 2). The total amount of greenhouse gases in the atmosphere at a specific point of time is a stock. On the other hand, the amount of greenhouse gases emitted into the atmosphere by human activities or absorbed by ecosystems over a specific period of time is a flow (Ajani et al., 2013).
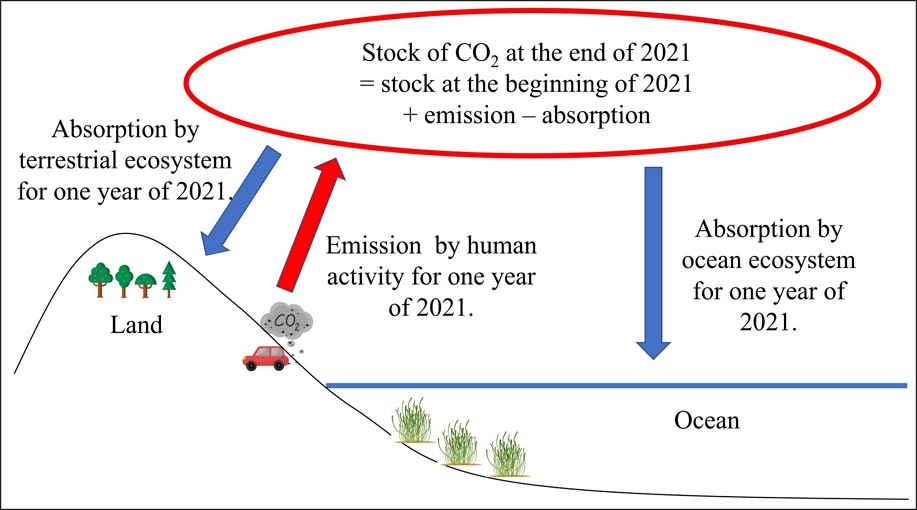
The boundary and factors for this study of greenhouse gas accounting. The spatial boundary for this study was defined as the global atmosphere and the time boundary for this study was defined as the year 2021. Among many kinds of greenhouse gases, only carbon dioxide (CO2) shall be included in this report. The emission by human activities and absorption by ecosystem are the only factors that are included as factors affecting the CO2 in the atmosphere for this study
A double-entry accounting system shows information about both flows and stocks, unlike a single-entry accounting system (Lee, 1977; Ovunda, 2015; Sangster, 2016). In particular, the double-entry accounting system can verify calculation errors by showing how flows and stocks are connected (Ellerman, 1985).
This double-entry accounting system can be used not only for financial calculation, but also for material calculation. Material flow analysis (MFA) is such system to calculate flows and stocks of materials (Brunner et al., 2004). There have been lots of studies to analyze the material flows, such as for steel stock in Japan (Daigo et al., 2007), marine debris in the global ocean (Jang et al., 2015) and rubber pollution (Sieber et al., 2020)
2.2. Boundary of accounting system of CO2 in this study
Both material flow analysis and double-entry accounting system need to define the accounting boundary and factors (Brunner, 2004). The boundary and factors for this study are shown on Fig. 2. The spatial boundary for this study was defined as the global atmosphere and the time boundary for this study was defined as the year 2021. The emission by human activities and absorption by ecosystem are the only factors that are included as factors affecting the CO2 in the atmosphere, for this study. Although there might be many other factors influencing the CO2 stock at the atmosphere, they were all neglected for the sake of simplicity, because the purpose of this study is to show the possibility and need of double entry accounting system for greenhouse gases. In this sense, moreover, only CO2 were calculated in this study, among many kinds of greenhouse gases.
2.3. Two reporting tables of accounting system for CO2
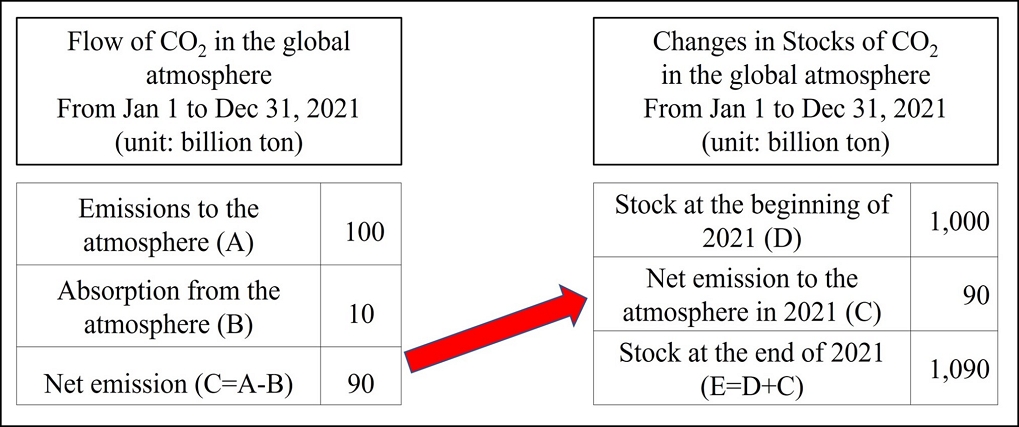
The double-entry accounting system for CO2 developed in this study consists of two reporting tables: <Flow of CO2> and <Changes in Stocks of CO2> (Fig. 3). The <Flow of CO2> shows the emission and absorption during the year of 2021. The <Changes in Stocks of CO2> shows the stocks at the beginning and the end of 2021. It is important to note that the net emission on <Flow of CO2> table is reflected in the table of <Changes in Stocks of CO2>. This allows for the verification of whether the estimation of each table is accurate. Most importantly, this double-entry accounting system for CO2 can show how flows (i.e., CO2 emissions and absorption) are connected to stocks (i.e., the total amount of CO2 in the atmosphere).
2.4. Data collection
The data on the flows and stock of CO2 required for the accounting report in this study were collected from previous scientific studies, as presented in the results section. Our primary objective in this study was to demonstrate the need and feasibility of a double-entry accounting system for greenhouse gases. Thus, we focused on identifying and utilizing the most reliable and relevant data currently available by carefully evaluating and comparing multiple research findings. Developing new data was beyond the scope of this study.
3. Result
3.1. Mass of CO2 in the atmosphere
As noted earlier, the creation of a double-entry accounting report for CO2 necessitates the expression flows (emissions and absorption) and atmospheric stock in a consistent unit of measurement. This study endeavors to employ mass (in tons) as the unit of measurement, since this unit is widely used in climate change-related reports to measure CO2 emissions and absorption. However, the stock amount of CO2 in the atmosphere is typically reported in parts per million (ppm), which denotes the ratio of CO2 molecules to all gas molecules in the atmosphere. Therefore, a crucial step in this study involves converting ppm to mass (in tons).
The total mass of the atmosphere is about 5,148,000 billion tons (Trenberth et al., 2005), and the concentration of CO2 in the atmosphere at the end of 2020 is 413.2 ppm (WMO, 2022). This means that out of one million gas molecules in the air, 413.2 molecules are CO2 molecules. However, we cannot calculate the mass of the CO2 in the air by just multiplying these two figures, because the mass of a gas molecule varies depending on the type of gas.
The mass of a gas molecule is the sum of the mass of the atoms that make up the molecule. For example, CO2 consists of one carbon atom and two oxygen atoms. The mass of one carbon atom is 12 g/mol, and the mass of one oxygen atom is 16 g/mol. (Here, "mol" stands for mole, which represents 6.02 × 10²³ particles. For example, if 6.02 × 10²³ carbon atoms gather, they would weigh about 8 grams.) Therefore, the mass of one CO2 molecule = (12 g/mol × 1 carbon atom) + (16 g/mol × 2 oxygen atoms) = 44 g/mol. And the average mass of the atmospheric gas molecules has been determined to be 28.97 g/mol by multiple researchers and reported in studies, including Jackson et al.(1998) and Zable (2010). Given that Nitrogen (N2) accounts for approximately 78% of the air's composition (Haynes, 2016), with a molecular mass of approximately 28 g/mol, the calculated average molecular mass of 28.97 g/mol can be considered reasonable. Using this information, we can calculate the mass of CO2 in the atmosphere as Table 1.
3.2. An accounting report on global CO2 in 2021
The accounting reports shown in <Table 2> and <Table 3> are created by integrating research data and by simple calculations. In summary, net emission of CO2 by human activities for one year of 2021 is 39.3 billion tons ("A" on Table 2). And the stock of CO2 in the global atmosphere at the end of 2021 is calculated as 3,246.6 billion tons ("E1" of Table 3).
In the note of <Table 2>, the conversion factor of 3.664 is driven as follows. The mass of one carbon atom is 12 g/mol, and the mass of one oxygen atom is 16 g/mol. Therefore, the mass of one CO2 molecule = (12 g/mol × 1 carbon atom) + (16 g/mol × 2 oxygen atoms) = 44 g/mol. Then, the mass of one molecule of CO2 shall be 3.664 times bigger than the mass of the carbon atom in the CO2 molecule, because 44 divided by 12 is about 3.664.
One notable point in <Table 3> is the "(F) The gap between the two figures of stocks." According to the principles of double-entry accounting, the amount of CO2 in the atmosphere at the end of 2021 (E) should be equal to the amount of CO2 in the atmosphere at the beginning of 2021 (D) plus the net emissions of CO2 (C). However, the sum of these values in <Table 3> (E1) is 3,246.6 billion tons, while the value estimated by scientists by measuring the concentration of CO2 in the atmosphere (E2) is 3,250 billion tons. The two values differ by 3.4 billion tons, demonstrating the verification function of double-entry bookkeeping accounting reports. Such an information of the value is not normally included in a financial accounting report. But it is included here to show that the estimates of CO2 by existing natural scientists may differ from one another.
3.3 Graphic information of CO2 accounting report in 2021
The double-entry accounting report of CO2 in 2021 can be summarized as a graphic information like <Fig. 4>. Here, the emission from human activities in 2021 (39.3 b tons) is only 1.2% of the stock of CO2 in the atmosphere (3,246.6 b tons). Carbon neutrality to reduce the 39.3 billion tons into 0 tons cannot reduce much portion of the stock of CO2 in the atmosphere. Such comparison of flow and stock by the same measuring unit is the power of double-entry accounting.
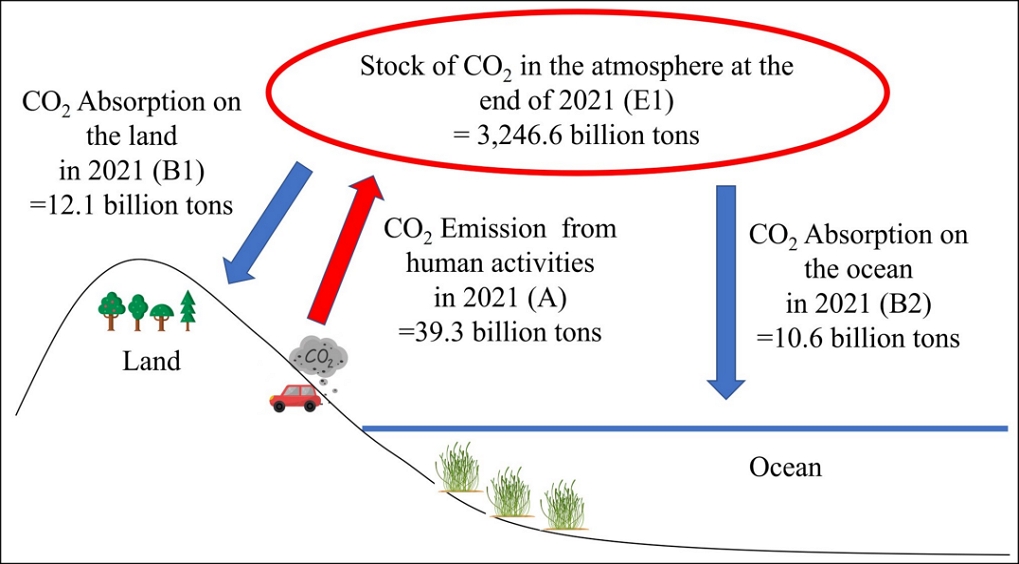
CO2 accounting reports in a graphic model. The emission from human activities in 2021 (39.3 b tons) is only 1.2% of the stock of CO2 in the atmosphere (3,246.6 b tons). Carbon neutrality to reduce the 39.3 billion tons into 0 tons cannot reduce much portion of the stock of CO2 in the atmosphere. Such comparison of flow and stock by the same measuring unit is the power of double-entry accounting.
4. Discussion
4.1. Definition of carbon neutrality
Although many people speak about carbon neutrality, or net zero, it is not clear what the carbon neutrality means. With the accounting report made in this study, carbon neutrality can be defined as one of the following two options (Table 4). The first option of carbon neutrality is reducing the current net emission (16.6 billion tons in 2021) into zero. Then, the human beings can emit CO2 as much as the nature absorbs (22.7 billion tons a year). The second option is reducing total emission from human activities (39.3 billion tons in 2021) into zero. Then, the nature (the land and the ocean) will absorb 22.7 billion tons a year.
This discussion shows why we need the CO2 accounting report system developed in this study. Until now, most of the other scientific reports about greenhouse gases sought so much scientific accuracy that the scientific reports were difficult to understand even for the policy decision-makers. Now, with the information in an easily understandable form by this accounting report, much more people can participate in policy decision making process. For example, more people can now discuss whether we should decrease the human emission of 39.3 billion tons into 0 tons or into 22.7 billion tons.
4.2. Evaluation of the effectiveness of carbon neutrality policies
Here for discussion purpose, let's define the carbon neutrality as the option 1 of <Table 4>, which means net emission of CO2 becomes 0 tons. Then, we can easily understand why such carbon neutrality policy is ineffective. This can be illustrated as <Fig. 5>. If all the countries succeed in carbon neutrality strategies, then the net emission of 16.6 b tons ("C" of Table 4) shall decrease into 0 tons. And if all the other conditions are the same, the stock of CO2 at the end of 2022 shall be 3,246.6 b tons, as same as 2021 (Fig. 5).
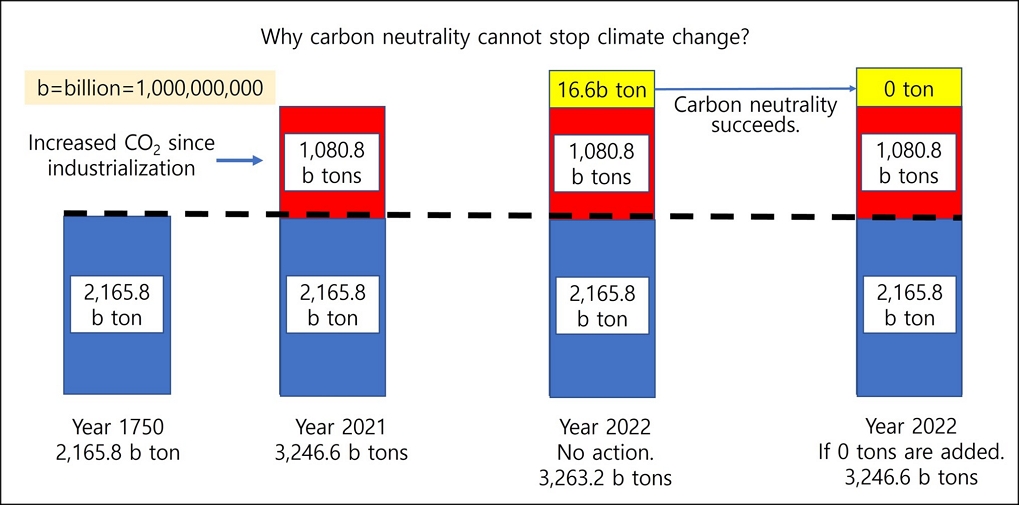
A graph showing why carbon neutrality cannot stop climate change. Even if carbon neutrality reduces 16.6 billion tons of annual net emissions into 0 tons, 1080.8 billion tons of CO2 will remain in the atmosphere, more than in 1750, causing climate change. Therefore, carbon neutrality can’t stop climate change
Now, let's compare this figure with the mass of CO2 before industrialization. The mass of CO2 in the atmosphere in 1750, when the concentration of CO2 in the atmosphere was 277 ppm (Friedlingstein et al., 2022) is estimated to be 2,165.8 billion ton, with the same way shown in <Table 1>. The estimated stock of CO2 in the atmosphere at the end of 2021 (3,246.6 b tons) is 1,080.8 b tons more (= 3.246.6 – 1,080.8) than 1750. These additional 1,080.8 billion tons are currently causing natural disasters such as wildfires, droughts, and floods worldwide.
In other words, as there are already too much CO2 added in the atmosphere after the industrialization, the portion that the human beings can reduce from carbon neutrality is too small to influence the total stock of CO2. The current net emission (16.6 billion tons) is only 1.5% of additional 1,080.8 billion tons since 1750, and it is only 0.5% of the CO2 stock in the atmosphere at the end of 2021.
If we interpret the carbon neutrality as option 2 of <Table 4>, then it means that 22.7 billion tons will be absorbed by the nature every year. If we divide the additional 1,080.8 billion tons by 22.7 billion tons, we get 48 years. As most of the countries are planning to achieve the carbon neutrality in 2050 (UNEP, 2022), the pre-industrialization level of CO2 shall be obtained in the year of 2098 (= 2050 + 48).
4.3. Uncertainty in estimation and comparison of different information
Estimating greenhouse gas emissions, absorption, and stock in the atmosphere is a challenging task even for natural scientists. Therefore, even in research papers by natural scientists, estimates of greenhouse gas emissions, absorption, and stock differ from each other. Such difference can be explained in terms of uncertainty in estimation. In the science of climate change, the issues of uncertainty in estimation have been raised and studied for a long time (e.g., Lim et al., 1999; Fauser et al., 2011; Tubiello et al., 2013; Lee et al., 2018). Therefore, the uncertainty level has even been recommended to be included in the report of national greenhouse gas inventories (e.g., Mastrandrea et al., 2011; Hiraishi et al., 2014).
However, the issue of uncertainty in estimation, although very important, requires high level of scientific knowledge and is difficult to understand. Therefore, accounting reports on greenhouse gases seek to provide easy-to-understand information for citizens by inserting the values surveyed and estimated by natural scientists into the accounting report framework. And re-estimating these values and clarifying the uncertainty issues goes beyond the scope of this research. Nevertheless, efforts to create an accounting report as reliable as possible by reviewing various different estimates are necessary. Therefore, various different estimates of the values included in the CO2 accounting report above were collected and compared for further study and critical review (Table 5).
Stock of CO2 , or the mass of CO2 in the atmosphere measured in tons, were unavailable from the scientific papers. Although websites for scientific papers such as Google Scholar (scholar.google.com) were searched with the terms like 'total mass of CO2 in the atmosphere,' there were no journal papers or reliable textbook appearing. More research is needed to express the CO2 stock in the air into the unit of mass.
5. Conclusion
For democratic policy-making, it is necessary to present and disclose relevant information in a form that all citizens can easily understand. As climate change has a significant impact on all citizens, it is necessary to listen to the opinions of citizens in formulating climate change response policies. However, information related to climate change is often too complex for both ordinary citizens and policymakers.
Therefore, in this paper, we presented information on the amount of greenhouse gases in a form of an accounting report using double-entry bookkeeping to make it much easier to understand. Specifically, based on the principle of double-entry bookkeeping, we compared the flow (emissions and absorption) of CO2 with its stock in the air.
As a result, the net amount of CO2 emitted into the atmosphere in one year of 2021 was calculated as 16.6 billion tons. The total amount of CO2 in the atmosphere at the end of 2021 was calculated as 3,246.6 billion tons, which is 1,080.8 billion tons more than in 1750, before industrialization. Even if all the countries in the world succeed in carbon neutrality and makes the net emission of 16.6 billion tons into 0 tons, there will still be 1,080.8 billion tons of more CO2 in the atmosphere than in 1750. And this surplus amount of 1,080.8 billion tons will lead to climate change with natural disasters such as wildfires, floods, and droughts.
Even though the strategy of carbon neutrality is insufficient to prevent climate change, the humanity is focusing its efforts to achieve this hopeless goal. It is time to find better policy responses against the climate change. This accounting method highlights the need to shift focus from mitigation to adaptation, as advocated by Pielke Jr (1998).
Although this study is based on general information about the flow (emission and absorption) and stock (concentration) of greenhouse gases, this study has value in the sense that the stock and the flow of CO2 was compared with each other in the same unit of measurement on a double-entry accounting report. This study assumed, however, that the damage from climate change has correlation with the amount of greenhouses gases even though the damage can vary depending on the social factors (Muttarak et al., 2014). Therefore, further discussions on these issues are needed along with efforts to improve double-entry accounting reports of greenhouse gases.
References
- Ajani JI, Keith H, Blakers M, Mackey BG, King HP. 2013. Comprehensive carbon stock and flow accounting: a national framework to support climate change mitigation policy. Ecological Economics. 89: 61-72.
- Beck EG. 2007. 180 years of atmospheric CO2 gas analysis by chemical methods. Energy & Environment. 18(2): 259-282.
- Brunner PH, Rechberger H. 2004. Practical handbook of material flow analysis. New York: Lewis Publishers.
-
Chen L, Msigwa G, Yang M, Osman AI, Fawzy S, Rooney DW, Yap PS. 2022. Strategies to achieve a carbon neutral society: a review. Environmental Chemistry Letters. 20(4): 2277-2310.
[https://doi.org/10.1007/s10311-022-01435-8]

-
Crippa M, Guizzardi D, Banja M, Solazzo E, Muntean M, Schaaf E, Pagani F, Monforti-Ferrario F, Olivier JGJ, Quadrelli R, Risquez Martin A, Taghavi-Moharamli P, Grassi G, Rossi S, Oom D, Branco A, San-Miguel J, Vignati E. 2022. CO2 emissions of all world countries. Luxembourg: Publications Office of the European Union.
[https://doi.org/10.2760/730164]

- Daigo I, Igarashi Y, Matsuno Y, Adachi Y. 2007. Accounting for steel stock in Japan. ISIJ International. 47(7): 1065-1069.
- Ellerman DP. 1985. The mathematics of double entry bookkeeping. Mathematics Magazine. 58(4): 226-233.
-
Fauser P, Sørensen PB, Nielsen M, Winther M, Plejdrup MS, Hoffmann L, Gyldenkærne S, Mikkelsen MH, Albrektsen R, Lyck E, Thomsen M, Hjelgaard K, Nielsen OK. 2011. Monte Carlo (Tier 2) uncertainty analysis of Danish Greenhouse gas emission inventory. Greenhouse Gas Measurement and Management. 1(3-4): 145-160.
[https://doi.org/10.1080/20430779.2011.621949]

- Fisher I. 1896. What is capital?. The Economic Journal 6(24): 509-534.
-
Friedlingstein P, Jones MW, O'Sullivan M, Andrew RM, Bakker DCE, Hauck J, Le Quéré C, Peters GP, Peters W, Pongratz J, Sitch S, Canadell JG, Ciais P, Jackson RB, Alin SR, Anthoni P, Bates NR, Becker M, Bellouin N,…Zeng J. 2022. Global carbon budget 2021. Earth System Science Data. 14(4): 1917-2005.
[https://doi.org/10.5194/essd-14-1917-2022]

- Haynes WM. 2016. CRC handbook of chemistry and physics. CRC Press.
- Hiraishi T, Krug T, Tanabe K, Srivastava N, Baasansuren J, Fukuda M, Troxler TG. 2014. 2013 supplement to the 2006 IPCC guidelines for national greenhouse gas inventories: Wetlands. IPCC, Switzerland.
- IPCC (Intergovernmental Panel on Climate Change). 2021. Summary for Policymakers. In: Climate Change 2021: The Physical Science Basis. Contribution of Working Group I to the Sixth Assessment Report of the Intergovernmental Panel on Climate Change. Masson-Delmotte V, Zhai P, Pirani A, Connors SL, Péan C, Berger S, Caud N, Chen Y, Goldfarb L, Gomis MI, Huang M, Leitzell K, Lonnoy E, Matthews JBR, Maycock TK, Waterfield T, Yelekçi O, Yu R, Zhou B (eds.). Cambridge University Press, Cambridge, United Kingdom and New York, NY, USA. pp.3-32.
- Jackson BA, Crouse DJ. 1998. Experimentally Determining the Molecular Weight of Carbon Dioxide Using a Mylar Balloon. Journal of Chemical Education. 75(8): 997.
-
Jang YC, Lee J, Hong S, Choi HW, Shim WJ, Hong SY. 2015. Estimating the global inflow and stock of plastic marine debris using material flow analysis: a preliminary approach. Journal of the Korean Society for Marine Environment & Energy. 18(4): 263-273.
[https://doi.org/10.7846/JKOSMEE.2015.18.4.263]

- Janssens-Maenhout G, Crippa M, Guizzardi D, Muntean M, Schaaf E, Olivier JGJ, Peters, JAHW, Schure KM. 2017. Fossil CO2 & GHG emissions of all world countries. Luxembourg: Publications Office of the European Union.
- Lee GA. 1977. The coming of age of double entry: the Giovanni Farolfi ledger of 1299-1300. The Accounting Historians Journal. 4(1): 79-95.
-
Lee JH, Woo J. 2020. Green new deal policy of South Korea: Policy innovation for a sustainability transition. Sustainability. 12(23): 10191.
[https://doi.org/10.3390/su122310191]

-
Lee SJ, Yim JS, Son YM, Son Y, Kim R. 2018. Estimation of forest carbon stocks for national greenhouse gas inventory reporting in South Korea. Forests. 9(10): 625.
[https://doi.org/10.3390/f9100625]

-
Li C, Huang J, Ding L, Liu X, Han D, Huang J. 2021. Estimation of oceanic and land carbon sinks based on the most recent oxygen budget. Earth's Future. 9(7): e2021EF002124.
[https://doi.org/10.1029/2021EF002124]

- Lim B, Boileau P, Bonduki Y, Van Amstel AR, Janssen LHJM, Olivier JGJ, Kroeze C. 1999. Improving the quality of national greenhouse gas inventories. Environmental Science & Policy. 2(3): 335-346.
-
Liu Z, Deng Z, Davis SJ, Giron C, Ciais P. 2022. Monitoring global carbon emissions in 2021. Nature Reviews Earth & Environment. 3: 217-219.
[https://doi.org/10.1038/s43017-022-00285-w]

-
Mastrandrea MD, Mach KJ, Plattner GK, Edenhofer O, Stocker TF, Field CB, Ebi KL, Matschoss PR. 2011. The IPCC AR5 guidance note on consistent treatment of uncertainties: a common approach across the working groups. Climatic Change. 108: 675-691.
[https://doi.org/10.1007/s10584-011-0178-6]

-
Muttarak R, Lutz W. 2014. Is education a key to reducing vulnerability to natural disasters and hence unavoidable climate change?. Ecology and Society. 19(1): 42.
[https://doi.org/10.5751/ES-06476-190142]

- Ovunda AS. 2015. Luca Pacioli’s double-entry system of accounting: A critique. Research Journal of Finance and Accounting. 6(18): 132-139.
- Pielke Jr, RA. 1998. Rethinking the role of adaptation in climate policy. Global Environmental Change. 8(2): 159-170.
-
Rogelj J, Schaeffer M, Meinshausen M, Knutti R, Alcamo J, Riahi K, Hare W. 2015. Zero emission targets as long-term global goals for climate protection. Environmental Research Letters. 10(10): 105007.
[https://doi.org/10.1088/1748-9326/10/10/105007]

-
Sangster A. 2016. The genesis of double entry bookkeeping. The Accounting Review. 91(1): 299-315.
[https://doi.org/10.2308/accr-51115]

-
Schreyer F, Luderer G, Rodrigues R, Pietzcker RC, Baumstark L, Sugiyama M, Brecha RJ, Ueckerdt F. 2020. Common but differentiated leadership: strategies and challenges for carbon neutrality by 2050 across industrialized economies. Environmental Research Letters. 15(11): 114016.
[https://doi.org/10.1088/1748-9326/abb852]

-
Sieber R, Kawecki D, Nowack B. 2020. Dynamic probabilistic material flow analysis of rubber release from tires into the environment. Environmental Pollution. 258: 113573.
[https://doi.org/10.1016/j.envpol.2019.113573]

- Trenberth KE, Guillemot CJ. 1994. The total mass of the atmosphere. Journal of Geophysical Research: Atmospheres. 99(D11): 23079-23088.
- Trenberth KE, Smith L. 2005. The mass of the atmosphere: A constraint on global analyses. Journal of Climate. 18(6): 864-875.
-
Tubiello FN, Salvatore M, Rossi S, Ferrara A, Fitton N, Smith P. 2013. The FAOSTAT database of greenhouse gas emissions from agriculture. Environmental Research Letters. 8(1): 015009.
[https://doi.org/10.1088/1748-9326/8/1/015009]

- UNEP (United Nations Environment Programme). 2022. Emissions Gap Report 2022: The Closing Window — Climate crisis calls for rapid transformation of societies. Nairobi.
- Verniani F. 1966. The total mass of the Earth's atmosphere. Journal of Geophysical Research. 71(2): 385-391.
-
Wei YM, Chen K, Kang JN, Chen W, Wang XY, Zhang X. 2022. Policy and management of carbon peaking and carbon neutrality: A literature review. Engineering. 14: 52-63.
[https://doi.org/10.1016/j.eng.2021.12.018]

- WMO (World Meteorological Organization). 2022. WMO Greenhouse Gas Bulletin: The State of Greenhouse Gases in the Atmosphere Based on Global Observations through 2021. No. 18.
-
Zable AC. 2010. Experiments with Helium‐Filled Balloons. The Physics Teacher. 48(9): 582-586.
[https://doi.org/10.1119/1.3517021]


