지중저장 이산화탄소의 잠재적 누출 모사에 따른 옥수수 초기 반응 및 생장 연구
Abstract
Carbon capture and storage (CCS) technology has been suggested as an ultimate strategy for mitigating climate change. However, potential leakage of CO2 from the CCS facilities could lead to serious damage to environment. Plants can be a bio-indicator for CO2 leakage as a cost-effective way, although plants’ responses vary with plant species. In this study, a greenhouse experiment was conducted to investigate the relation between the CO2 tolerance of corn species and the initial physiological responses to the elevated soil CO2 concentration. Treatment groups included CI (99.99% CO2 gas injection) and BI (no gas injection). Mean soil CO2 concentration for the CI treatment was 19.5∼39.4%, and mean O2 concentration was 6.6∼18.4%. The soil gas concentrations in the BI treatment were at the ambient levels. In the CI treatment, chlorophyll content was not decreased until the 13th day of the CO2 injection. On the 15th day, leaf starch content and stomatal conductance were increased by 89% and 25% in the CI treatment compared to the BI treatment, respectively. This might be due to the compensatory reaction of corn to avoid high soil CO2 stress. However, the prolonged CO2 injection decreased chlorophyll content after 13 days. After CO2 injection, plant biomass was reduced by 25% in the CI treatment compared to the BI treatment. Due to the inhibited root growth, leaf phosphorous and potassium contents were decreased by 54% on average in the CI treatment. This study indicates that corn has a high tolerance to soil CO2 concentration of 30% for 2 weeks by its compensatory reactions such as an maintenance of chlorophyll content and an increase in stomatal conductance.
Keywords:
Carbon Capture and Storage (CCS), Corn, Bio-Indicator, Compensatory Reaction, Stomatal Conductance1. 서 론
기후변화의 주요 원인 기체인 이산화탄소(CO2)는 대기 중 농도가 지속적으로 증가하여 환경에 부정적 영향을 야기하고 있다(IPCC, 2005). 탄소 포집 및 저장(Carbon Capture and Storage; CCS) 기술은 발전소 및 산업시설에서 배출되는 이산화탄소를 포집하여 파이프라인 및 선박 등을 이용하여 수송하고, 지중 및 해양에 저장시켜 격리시키는 기술로써 기후변화를 완화할 수 있는 주요 기술 중 하나로 제안되고 있다(IEA, 2012; IPCC, 2014). 그러나 고압축 상태로 저장된 CO2는 자연적 지층교란이나 파이프라인 부식 및 접합부의 손상 등을 통해 누출될 가능성이 있으며, 이는 토양 및 생태계에 잠재적 위험을 초래할 수 있다고 보고된다(Haszeldine, 2009; West et al., 2009). 따라서 CCS 기술의 안전성 확보를 위해 토양 내 CO2의 잠재적 누출로 인한 식생 및 환경에 미치는 영향을 이해하는 것이 중요할 것이다.
지중저장 CO2의 잠재적 누출에 대한 환경 영향평가를 위해 미국, 영국, 중국, 스페인 등 여러 나라에서는 CO2 인위 누출 실험을 진행하였다(Ko et al., 2016). 식물은 고농도의 토양 CO2에 의해 광합성 및 뿌리 호흡 등의 물질대사가 억제되고, 잎의 노화 및 탈색이 촉진되는 등 생장 전반에 부정적 영향을 받는 것으로 보고되었다(West et al., 2009; Spangler et al., 2010; Patil, 2012; Sharma et al., 2014). 반면, 미생물의 군집 크기 및 활성도는 토양 CO2 누출에 대해 일반화된 반응을 보이지 않았다(West et al., 2009; Smith et al., 2013; Morales and Holben, 2014; Feitz et al., 2014; Fernandez-Montiel et al., 2015). 따라서 식물은 CCS 시설 주변 넓은 부지에 대해 토양 CO2 누출을 모니터링하고 감지하는데 간편하고 비용효과적인 생물지표(Bioindicator)로써 제안되고 있다(Stalker et al., 2011; Patil, 2012).
고농도의 토양 CO2에 대한 식물의 반응은 식물 종에 따라 달라질 수 있는데, 이는 식물마다 스트레스에 대한 저항성이 다르기 때문이다(Lichtenthaler, 1996). Patil(2012)은 토양 CO2 주입 지점 주변에 외떡잎식물이 쌍떡잎식물에 비해 높은 비율로 존재하는 것을 관찰함으로써, 외떡잎식물이 쌍떡잎식물보다 토양 CO2 증가에 대해 높은 저항성을 나타내는 것을 확인하였다. 외떡잎식물 중 하나인 옥수수는 고농도의 토양 CO2에 대해 높은 내성을 보이는 것으로 보고되었다(Noomen and Skidmore, 2009). Al-Traboulsi et al.(2013)은 토양 CO2를 2개월간 누출시킨 구역에서 콩보다 옥수수의 곁뿌리 개수 및 원뿌리 길이의 감소가 적은 것을 관찰하였으며, Wu et al.(2014)도 여러 농도의 CO2를 토양 내로 한 달 동안 누출시킨 실험에서 알팔파보다 옥수수의 뿌리 성장 저해가 적은 것을 확인하였다. 고농도의 CO2에 대한 저항성 및 내성은 식물의 보상작용에서 기인한 것으로 사료되는데, Kim et al.(2017)의 연구에서 고농도의 토양 CO2에 노출된 식물은 엽록소 함량을 일시적으로 증가시킴으로써 토양 CO2에 의해 입은 손상을 보상한다고 보고되었다. 따라서 토양 CO2 모니터링 기법으로써 식물을 생물지표로 활용하기 위해서는 식물 종에 따른 누출 초기의 보상작용과 같은 저항 메커니즘에 대한 이해가 필수적일 것이다.
본 연구는 토양 CO2에 대한 내성이 식물의 토양 CO2 누출에 대한 초기 생장 및 생리적 반응과 어떠한 관련성이 있는지 알아보고자 수행하였다. 본 연구의 목적은 1) 토양 CO2 누출에 대해 내성이 있다고 알려진 옥수수의 초기 저항 및 보상 반응을 알아보고, 2) CCS 저장소 및 수송관에서의 CO2 누출 감지를 위한 생물 지표로써 옥수수의 적용 가능성을 확인하는데 있다.
2. 재료 및 방법
2.1 온실 배양 실험
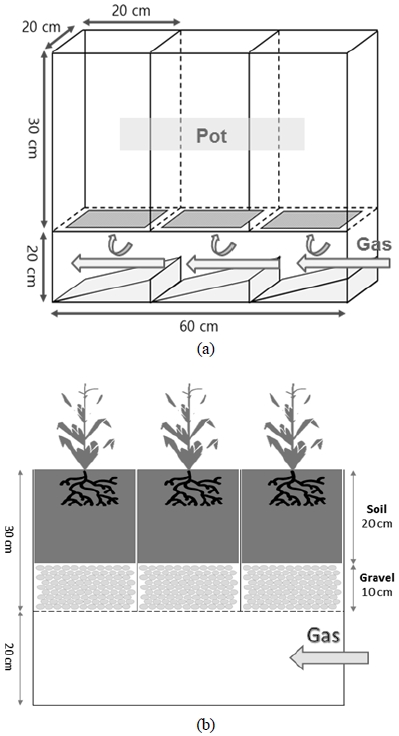
본 실험은 경희대학교 캠퍼스 내 설치된 온실에서 수행되었다. 누출 실험은 아크릴 재질로 자체 제작한 생장 실험 용기(growth box)에서 진행되었는데(Yoo et al., 2016; Kim et al., 2017), 이는 식물을 위한 세 개의 화분 공간(길이 20 cm, 너비 20 cm, 높이 30 cm)과 그 아래쪽에 기체 순환 및 확산을 돕는 하나의 공간을 한 세트로 구성되었다(Fig. 1a). 각 화분 공간 아랫면에는 9개의 구멍(직경 2 cm)이 존재하는데, 이는 기체 주입구를 통하여 주입된 기체가 하단부 챔버에서 화분공간으로 확산될 수 있도록 해준다. 화분 공간에는 육모용 상토(potting soil)와 무기질 토양(mineral soil)을 1:1(v/v)의 비율로 섞은 혼합토를 Fig. 1(b)와 같이 조성하였다. 육모용 상토는 시중에 판매되고 있는 것을 구입하였으며, 무기질 토양은 경기도 수원시 골재 판매처를 통해 구비하였다. 육모용 상토와 무기질 토양의 기초 자료는 Table 1에 나타내었다. 비교적 성장 및 발달 상태가 비슷한 옥수수(Zea mays) 개체들을 선별하여 2016년 6월 23일에 Fig. 1(b)와 같이 생장실험 용기에 식재하였다. 선별 개체들은 기체 주입 실험 시작 전 2주간 생장 적응시켰다.
기체 주입은 2016년 7월 6일부터 8월 4일까지 총 30일간 진행되었다. 처리구는 99.99%의 CO2 기체를 100 mL min-1의 유량으로 주입한 CI(CO2 injection)이고, 대조구는 어떠한 기체도 처리하지 않은 BI(no injection)이다. 실험은 옥수수에 대해 각 처리구별 6반복으로 진행되었다. 각 옥수수가 식재되어 있는 토양에 2일 간격으로 평균 400 mL의 수분 공급을 하였으며, 온실 내의 온도는 약 33.4℃가 유지되었다.
2.2 토양 및 식물 분석
토양 내 기체 주입 기간 동안 토양 CO2/O2 농도, pH, 온도 및 수분함량, 식물 잎의 엽록소 함량을 주기적으로 측정하였다. 토양 내 CO2/O2 농도는 토양 내 실리콘 튜브(직경 2 mm)를 각 옥수수의 토양에 수직 5 cm, 15 cm 깊이로 설치하여 휴대용 센서(Status Scientific Controls LTD, Nottinghamshire, UK)를 이용하여 2일 간격으로 측정하였다. 토양 pH는 토양과 증류수를 1:5(w/v)의 비율로 혼합하여 1시간 교반 후, pH meter (Orion 3star, Thermo, USA)를 이용하여 2일 간격으로 측정하였다. 토양 온도 및 수분도 2일 간격으로 휴대용 센서(Procheck, Daegon Devices, Washington, USA)를 이용하여 측정하였다. 엽록소 함량은 SPAD meter(SPAD-502, Minolta, Japan)을 이용하여 일주일에 3번 일정한 간격을 두고 측정하였는데, SPAD meter는 광학의 원리를 이용한 간편한 측정 기기로써 엽록소 a 및 b 함량과 높은 양의 상관관계를 나타낸다고 보고된다(Woo et al., 2004). 잎의 전분 농도 및 기공전도도는 엽록소 함량의 변화가 처리구에 따라 유의하게 차이를 보이는 시점인 누출 시작 후 15일에 측정하였으며, 각각 Total starch kit (Megazyme, Ireland)와 LI-6400XT portable device(LI-COR, USA)를 이용하여 분석하였다.
CO2 기체 누출이 종료된 후에는 CI와 BI의 옥수수 모습을 기록하기 위해 사진 촬영을 하였고, 옥수수를 수확하여 지상부와 뿌리로 나누어 분석을 진행하였다. 바이오매스 측정을 위해 지상부와 뿌리의 길이를 자로 재어 그 길이를 기록하였다. 모든 옥수수 속대의 수의 세어 처리구 및 대조구의 총 합을 구하였다. 잎 내 총 탄소 및 질소 함량은 Carlo Erba NS 1500 C/N analyzer(Carlo Erba, Milan, Italy)를 이용하여 분석하였고, 잎 내 총 인, 칼륨, 마그네슘 및 칼슘 함량은 ICP Optical Emission Spectrometer(ICAP 7400 Duo, USA)를 이용하여 분석하였다.
2.3 통계분석
통계분석은 SAS 9.4의 일반선형모델(General Linear Model; GLM) 과정을 이용하여 처리구별 95% 신뢰수준에서 분산분석을 수행하였다(SAS Institute, 2013). 분석은 토양 pH, SPAD 값, 잎 내 전분 함량 및 기공전도도, 지상부 및 뿌리 길이, 잎 내 총 탄소(TC), 질소(TN), 인(TP), 칼륨(K), 마그네슘(Mg) 및 칼슘(Ca) 함량에 대해 실시하였다.
3. 결과 및 토의
3.1 토양 환경 조건
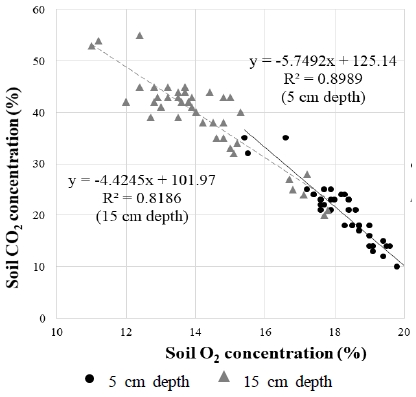
누출 기간 동안 CI 처리구의 평균 토양 CO2 농도는 5 cm, 15 cm 깊이에서 각각 19.5%, 39.4%였으며, 토양 O2 농도는 각 깊이에서 평균 18.4%, 6.6%를 유지하였다(Table 2). 또한 토양 내 CO2 주입에 따라 CI 처리구에서 토양 CO2와 O2 농도는 유의하게 음의 상관관계를 보였다(Fig. 2). 이는 지속적으로 CO2 기체가 토양 내로 누출되면 주입된 CO2가 토양 O2를 대체하여 농도를 감소시킨다는 선행연구와 일치하는 결과이다(Al-Traboulsi et al., 2013, 2012a, 2012b; Lakkaraju et al., 2010; Patil et al., 2010; Wu et al., 2014). 반면, 기체를 주입하지 않은 대조구 BI의 토양 O2 농도는 대기와 같은 수준이었으며, CO2 농도는 배경농도와 같았다(Table 2).
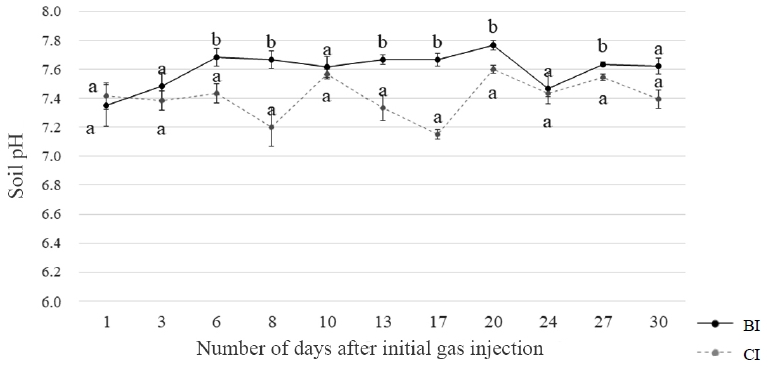
토양 pH는 CO2 누출 기간 동안 BI 대비 CI에서 소폭 감소한 상태를 대체로 유지하였으나, 그 차이는 평균적으로 0.3 단위 내외였다(Table 2, Fig. 3). 이는 혼합토 내 포함된 유기물 함량이 높은 배양토의 특징 때문으로 사료되는데, Curtin and Trolove(2013)에 따르면 토양 유기물은 표면에 존재하는 카르복실기 및 페닐기와 같은 작용기로 인하여 pH 변화에 대해 높은 완충효과를 나타낸다고 보고하였다. 또한, 식물은 근권 환경의 이온 균형을 맞추기 위하여 중탄산이온(HCO3-)을 방출하는데, 이 역시 토양 pH 변화를 완화시키는 요인 중 하나일 것이다(Hinsinger et al., 2003).
3.2 식물 형태학 및 생리학적 변화
토양 CO2 누출을 30일간 지속한 후 옥수수의 형태학적 변화를 Fi.g 4(a)에 나타내었다. 옥수수는 키가 감소되고 잎이 쳐지는 것이 관찰되었지만, 생명 유지에는 문제가 없는 모습을 보였다. 토양 CO2가 증가된 환경에서 옥수수는 생장량이 감소되었지만, 생명을 유지시킬 수 있는 새로운 생장 평형에 도달했음을 추측할 수 있다.
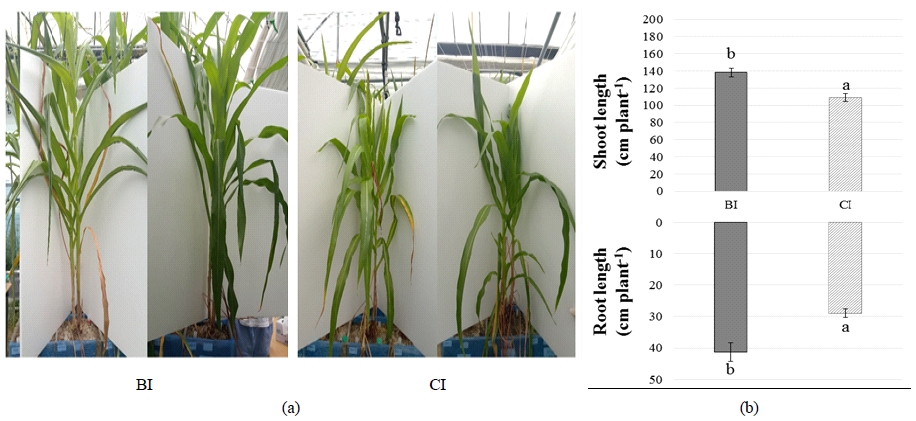
Treatment effects on morphological changes of corn leaves (a) and shoot/root lengths (b). (BI: no gas injection, CI: CO2 gas injection). Vertical lines represent the standard error (n=6) and bars with different letters indicate a significant difference at a 5% significance level.
배양이 종료된 후 수확한 옥수수의 지상부 및 뿌리 길이를 측정한 결과는 CI에서 BI 대비 지상부는 약 21%, 뿌리는 약 30% 감소하였다(Fig. 4b). 옥수숫대에 열린 옥수수의 개수는 CI에서 BI 대비 약 43% 감소하였다. 이러한 결과는 지속적인 CO2의 누출로 인해 옥수수는 생장저해기를 겪게 되고, 결과적으로 바이오매스 생장 및 생식기능이 저해되었음을 의미한다. 옥수수의 뿌리는 지상부에 비해 더 뚜렷하게 길이가 감소하였는데, 이는 고농도의 토양 CO2에 대해 뿌리가 직접적인 영향을 받기 때문으로 사료된다(He et al., 2016).
옥수수 잎의 TC, TN, TP, K, Mg 및 Ca 함량 분석 결과, TC, TN, Mg 함량은 처리구 및 대조구 간에 유의한 차이가 없었는데, TP, K 및 Ca의 잎 내 함량은 CI에서 BI 대비 평균 54 % 감소하였다(Table 3). 이는 고농도 토양 CO2로 인하여 뿌리가 손상된 결과, 양분 흡수 및 수송이 억제되었음을 의미한다(Chang and Loomis, 1945). 감소된 영양염류 함량은 잎 내 전분 농도와 기공전도도에 영향을 줄 수 있다. CO2 누출 후 15일에 측정한 잎의 전분 농도와 기공전도도는 CI에서 BI 대비 각각 87%, 25% 증가하였다(Fig. 5). 식물은 광합성 산물인 전분을 세포 및 조직 형성에 이용하려면 TP, K와 같은 영양염류가 충분히 확보되어야 하지만, 토양 CO2에 의해 영양염류의 공급이 감소되면서 합성된 전분이 세포 및 조직 형성에 이용되지 못하고, 엽록체 내 스트로마에 축적된 것으로 보인다(Taiz et al., 2015). 또한, K과 Ca은 공변세포가 삼투현상에 의해 팽창되어 기공이 닫히도록 유도하는데(Schroeder et al., 2001; Taiz et al., 2015), 증가된 토양 CO2로 인하여 감소된 잎 내 K 및 Ca 함량은 기공이 닫히는 메커니즘의 속도를 느리게 하여 기공전도도에 영향을 준 것으로 추측된다.
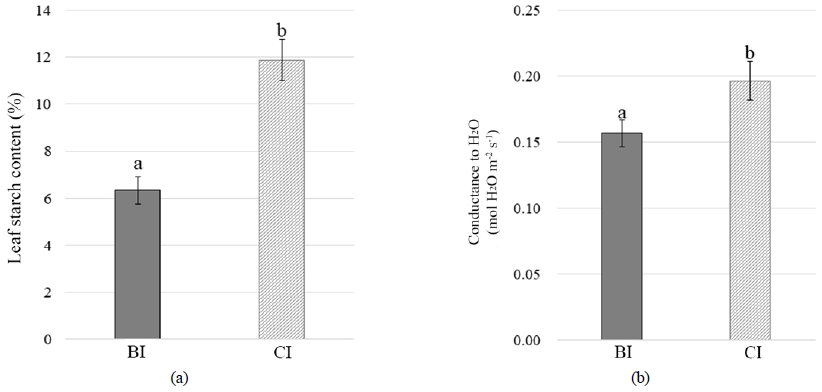
Treatment effects on leaf starch content (a) and stomatal conductance (b). (BI: no gas injection, CI: CO2 gas injection). Vertical lines represent the standard error (n=6) and bars with different letters indicate a significant difference at a 5% significance level.
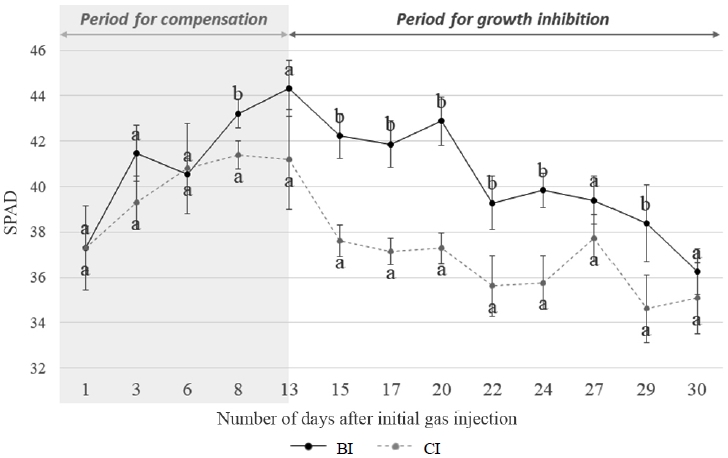
기체 주입 기간 동안 측정한 SPAD 측정 결과, 누출 초기 13일까지 SPAD 값은 처리구 및 대조구 간에 유의한 차이를 보이지 않았으나, 이후 지속된 CO2의 누출로 인하여 SPAD 값은 CI에서 BI 대비 평균 9% 감소하였다(Fig. 6). 초기 약 2주 동안 CI와 BI 간의 차이가 없는 것은 토양 CO2가 증가로 인한 생장 및 양분 대사의 저해를 보상하고자 옥수수가 엽록체를 정상 수준으로 유지시키기 위한 ‘보상작용’을 한 것으로 사료된다(Kim et al., 2017). 이러한 보상작용에도 불구하고, 토양 CO2의 지속적인 주입은 엽록소 함량을 감소시켰는데, 이는 토양 CO2 증가로 인한 대사작용의 저해로 인한 엽록소 생성과정에 영향을 주었기 때문으로 추측된다(Vodnik et al., 2006; Bellante et al., 2014).
4. 결 론
본 연구에서 옥수수는 토양 내 CO2 농도 약 30%에 30일 동안 노출되었을 때, 생리적 반응 및 생장, 생식 등이 전반적으로 저해되었지만 생명을 유지할 수 있었다. 그리고 초기 2주 동안에는 엽록체 함량을 유지시키는 보상작용을 통하여 엽록소 함량을 유지시키고, 이에 따른 부정적 영향의 발현을 지연시켰음을 알 수 있었다. 좁은 국토 면적을 가진 우리나라의 경우, CCS 시설주변에 자연 상태의 초지보다 작물이 식재될 경우가 더 많을 것이므로, 작물을 이용한 토양 CO2 농도 변화를 감지하는 민감한 생물지표(Bio-indicator)로써 옥수수는 적절하지 않다고 사료된다. 오히려 CCS 시설 주변 토양에 작물을 식재하여 경작을 해야만 한다면 옥수수와 같이 고농도 CO2에 민감하지 않은 종이 활용될 수 있을 것으로 제안한다.
Acknowledgments
본 연구는 환경부 이산화탄소저장 환경관리(K-COSEM) 기술개발사업(과제번호: 2014001810002)에 의해 수행되었습니다.
References
-
Al-Traboulsi, M, Sjogersten, S, Colls, J, Steven, M, Black, C., (2013), Potential impact of CO2 leakage from Carbon Capture and Storage (CCS) systems on growth and yield in maize, Plant Soil, 365, p267-281.
[https://doi.org/10.1007/s11104-012-1390-5]

-
Bellante, GJ, Powell, SL, Lawrence, RL, Repasky, KS, Dougher, T., (2014), Hyperspectral detection of a subsurface CO2 leak in the presence of water stressed vegetation, PLoS One 9.
[https://doi.org/10.1371/journal.pone.0108299]

-
Chang, HT, Loomis, WE., (1945), Effect of carbon dioxide on absorption of water and nutrients by roots, Plant Physiol, 20, p221-232.
[https://doi.org/10.1104/pp.20.2.221]

-
Curtin, D, Trolove, S., (2013), Predicting pH buffering capacity of New Zealand soils from organic matter content and mineral characteristics, Soil Res, 51, p494-502.
[https://doi.org/10.1071/sr13137]

-
Feitz, A, Jenkins, C, Schacht, U, McGrath, A, Berko, H, Schroder, I, Noble, R, Kuske, T, George, S, Heath, C, Zegelin, S, Curnow, S, Zhang, H, Sirault, X, Jimenez-Berni, J, Hortle, A., (2014), An assessment of near surface CO2 leakage detection techniques under Australian conditions, Energy Procedia, 63, p3891-3906.
[https://doi.org/10.1016/j.egypro.2014.11.419]

- Fernandez-Montiel, I, Touceda, M, Pedescoll, A, Gabilondo, R, Prieto-Fernandez, A, Becares, E., (2015), Short-term effects of simulated below-ground carbon dioxide leakage on a soil microbial community, Int J Greenhouse Gas Control, 36, p51-59.
-
Haszeldine, RS., (2009), Carbon capture and storage: How green can black be?, Science, 325, p1647-1652.
[https://doi.org/10.1126/science.1172246]

-
He, W, Moonis, M, Chung, H, Yoo, G., (2016), Effects of high soil CO2 concentrations on seed germination and soil microbial activities, Int J Greenhouse Gas Control, 53, p117-126.
[https://doi.org/10.1016/j.ijggc.2016.07.023]

- He, W, Moonis, M, Kim, YJ, Yoo, G., (2017), Impact assessment of potential CO2 leakage from the carbon capture and storage site on plant growth and soil environment (submitted).
-
Hinsinger, P, Plassard, C, Caixian, T, Jaillard, B., (2003), Origins of root-mediated pH changes in the rhizophere and their responses to environmental constraints: A review, Plant Soil, 248, p43-59.
[https://doi.org/10.1023/a:1022371130939]

- IEA (OECD), (2012), Energy technology perspectives 2012: Pathwayas to a clean energy system, France.
- IPCC (Intergovernmental Panel on Climate Change), (2005), Special report on carbon dioxide capture and atorage, Prepared by working group III of the intergovernmental panel on climate change, Cambridge University Press, Cambridge, UK and New York, USA.
- IPCC, (2014), Mitigation of climate change, Contribution of working group III to the fifth assessment report of the intergovernmental panel on climate change, Cambridge University Press, Cambridge, UK and New York, USA.
- Kim, YJ, He, W, Ko, D, Chung, H, Yoo, G., (2017), Increased N2O emission by inhibited plant growth in the CO2 leaked soil environment: Simulation of CO2 leakage from carbon capture and storage (CCS) site, Sci Tot Environ, 607-608, p1278-1285.
-
Ko, D, Yoo, G, Yun, S, Chung, H., (2016), Impacts of CO2 leakage on plants and microorganisms: A review of results from CO2 release experiments and storage sites, Greenhouse Gases Sci Technol, 6, p319-338.
[https://doi.org/10.1002/ghg.1593]

- Lake, JA, Steven, MD, Smith, K, Lomax, BH., (2012), Environmental impact of a hypothetical catastrophic leakage of CO2 onto the ground surface, J Pipeline Eng, 33, p648-683.
-
Lakkaraju, VR, Zhou, X, Apple, ME, Cunningham, A, Dobeck, LM, Gullickson, K, Spangler, LH., (2010), Studying the vegetation response to simulated leakage of sequestered CO2 using spectral vegetation indices, Eco Inform, 5, p379-389.
[https://doi.org/10.1016/j.ecoinf.2010.05.002]

-
Lichtenthaler, HK., (1996), Vegetation stress: An introduction to the stress concept in plants, Plant Physiol, 148, p4-14.
[https://doi.org/10.1016/s0176-1617(96)80287-2]

-
Morales, SE, Holben, WE., (2013), Functional response of a near-surface soil microbial community to a simulated underground CO2 storage leak, PLoS One, 8, p1-10.
[https://doi.org/10.1371/journal.pone.0081742]

-
Noomen, MF, Skidmore, AK., (2009), The effects of high soil CO2 concentrations on leaf reflectance of maize plants, Int J Remote Sens, 30, p481-497.
[https://doi.org/10.1080/01431160802339431]

- Patil, R., (2012), Impacts of carbon dioxide gas leaks from geological storage sites on soil ecology and above-ground vegetation, Divers Ecosyst 27-50.
-
Patil, RH, Colls, JJ, Steven, MD., (2010), Effects of CO2 gas as leaks from geological storage sites on agro-ecosystems, Energy, 35, p4587-4591.
[https://doi.org/10.1016/j.energy.2010.01.023]

- Pfanz, H, Saβmannshausen, F., (2008), Geogenic CO2-exhalations and vegetation: Its possible use to predict volcanic eruptions, Geophysical Research Abstracts, Vol. 10, EGU2008-A-12108, EGU General Assembly 2008.
-
Schroeder, J, Kwak, J, Allen, G., (2001), Guard cell abscisic acid signalling and engineering drought hardiness in plants, Nature, 410(6826), p327.
[https://doi.org/10.1038/35066500]

-
Sharma, B, Apple, ME, Zhou, X, Olson, JM, Dorshorst, C, Dobeck, LM, Cunningham, AB, Spangler, LH., (2014), Physiological responses of dandelion and orchard grass leaves to experimentally released upwelling soil CO2, Int J Greenhouse Gas Control, 24, p139-148.
[https://doi.org/10.1016/j.ijggc.2014.03.006]

-
Smith, KL, Steven, MD, Jones, DG, West, JM, Coombs, P, Green, KA, Barlow, TS, Breward, N, Gwosdz, S, Kruger, M, Beaubien, SE, Annunziatellis, A, Graziani, S, Lombardi, S., (2013), Environmental impacts of CO2 leakage: Recent results from the ASGARD facility, UK, Energy Procedia, 37, p791-799.
[https://doi.org/10.1016/j.egypro.2013.05.169]

-
Spangler, LH, Dobeck, LM, Repasky, KS, Nehrir, AR, Humphries, SD, Barr, JL, Keith, CJ, Shaw, JA, Rouse, JH, Cunningham, AB, Benson, SM, Oldenburg, CM, Lewicki, JL, Wells, AW, Diehl, JR, Strazisar, BR, Fessenden, JE, Rahn, TA, Amonette, JE, Barr, JL, Pickles, WL, Jacobson, JD, Silver, EA, Male, EJ, Rauch, HW, Gullickson, KS, Trautz, R, Kharaka, Y, Birkholzer, J, Wielopolski, L., (2010), A shallow subsurface controlled release facility in Bozeman, Montana, USA, for testing near surface CO2 detection techniques and transport models, Environ Earth Sci, 60, p227-239.
[https://doi.org/10.1007/s12665-009-0400-2]

- Stalker, L, Noble, R, Pejcic, B, Leybourne, M, Hortle, A, Michael, K., (2011), Feasibility monitoring techniques substances mobilised CO2 storage geological formations, Energy Procedia, Cheltenham, UK.
- Taiz, L, Zeiger, E, Moller, IM, Murphy, A., (2015), Plant physiology and development, Sinauer Associates, Incorporated.
-
Vodnik, D, Kastelec, D, Pfanz, H, Mack, I, Turk, B., (2006), Small-scale spatial variation in soil CO2 concentration in a natural carbon dioxide spring and some related plant responses, Geoderma, 133, p309-319.
[https://doi.org/10.1016/j.geoderma.2005.07.016]

-
West, JM, Pearce, JM, Coombs, P, Ford, JR, Scheib, C, Colls, JJ, Smith, KL, Steven, MD., (2009), The impact of controlled injection of CO2 on the soil ecosystem and chemistry of an English lowland pasture, Energy Procedia, 1, p1863-1870.
[https://doi.org/10.1016/j.egypro.2009.01.243]

- Woo, S, Lee, SH, Lee, DS., (2004), Air pollution effects on photosynthesis and chlorophyll contents of street trees in Seoul, Korean J Agric For Meteorol, 6, p24-29.
-
Wu, Y, Ma, X, Li, YE, Wan, YF., (2014), The impacts of introduced CO2 flux on maize/alfalfa and soil, Int J Greenhouse Gas Control, 23, p86-97.
[https://doi.org/10.1016/j.ijggc.2014.02.009]

-
Yoo, SY, Song, YJ, Oh, HJ, Kim, YJ, Yoo, G., (2016), Applicability of DGCI (Dark Green Color Index) to assess potential impacts of CO2 leakage from the geological storage site, J Climate Change Res, 7, p351-356.
[https://doi.org/10.15531/ksccr.2016.7.3.351]

